Observability
Observability is tooling or a technical solution that allows teams to actively debug their system. Observability is based on exploring properties and patterns not defined in advance. This definitaion somewhat summarizes what Observability means.
For your software system to be observable, the telemetry collected and how its process helps diagnose and investigate better.
Observability is a close cousin of monitoring, but it’s actually different. Monitoring can be considered as a subset of observability. Whereas monitoring focuses on predefined metrics, logs and traces, observability focuses on the predefined and the undefined. Of course, because one can not tell what will need to be debugged tomorrow. I am guessing, otherwise it will probably be fixed today.
There are three main telemetry types considered to build observability.
i) Metric: Measurements of a attributes of a resource or system.
ii) Logs: Automatically generated timestamped records of various types of events. They could either be structured as json or unstructured.
iii) Traces: Traces are designed to track the way lifecycle or of an event or request with application or infrastructure components. I wrote about it here
There are so many tools to measure and record logs, traces or metrics. However, the best observability system should not treat these telemetry types as independent. Since most of them are related in one way or the other. For example entries in a log file could be related to a traceId in the distributed system which could affect one or two metric attributes of a resource.
In this post, I will show how we can build an observability stack that does not treat the telemetry types as independent systems.
Building the Stack
As already mentioned, with each telemetry type we will us a different tool.
i) Metric: Prometheus
ii) Logs: Loki
iii) Traces: Tempo
And then using Grafana bring all of them together. The source code canbe found here. I have also packaged everything using FluxCD, which can also run on minikube so you should be able to test.
- To get started, first clone the repo and cd into it.
- Run
make install-flux, which should install FluxCD. - Once FluxCD is installed we can proceed and install the stack by running
make install-allThis will first create a namespace and then install: i. prometheus-grafana ii. tempo iii. loki
An important part to notice is the helm values for the prometheus-grafana installation.
1
2
3
4
5
6
7
8
9
10
11
12
13
14
15
16
17
18
19
20
21
22
23
24
25
grafana:
  enabled: true
  adminPassword: password

  additionalDataSources:
    - name: Loki
      type: loki
      uid: loki
      url: http://loki.observability-system.svc.cluster.local:3100
      access: proxy
      editable: true
      jsonData:
        derivedFields:
          - datasourceUid: tempo
            matcherRegex: ((\d+|[a-z]+){5}(\d+|[a-z]+){5}(\d+|[a-z]+){4})
            name: TraceID
            url: "$${__value.raw}"
      version: 1
    - name: Tempo
      type: tempo
      uid: tempo
      url: http://tempo.observability-system.svc.cluster.local:3100
      access: proxy
      editable: true
      version: 1
The default value for the kube-prometheus-stack is to have prometheus enabled and set as the default datasource, so we don’t need to patch that value.
Secondly, we enabled Grafana using grafana.enabled: true and se the default password as p@ssword
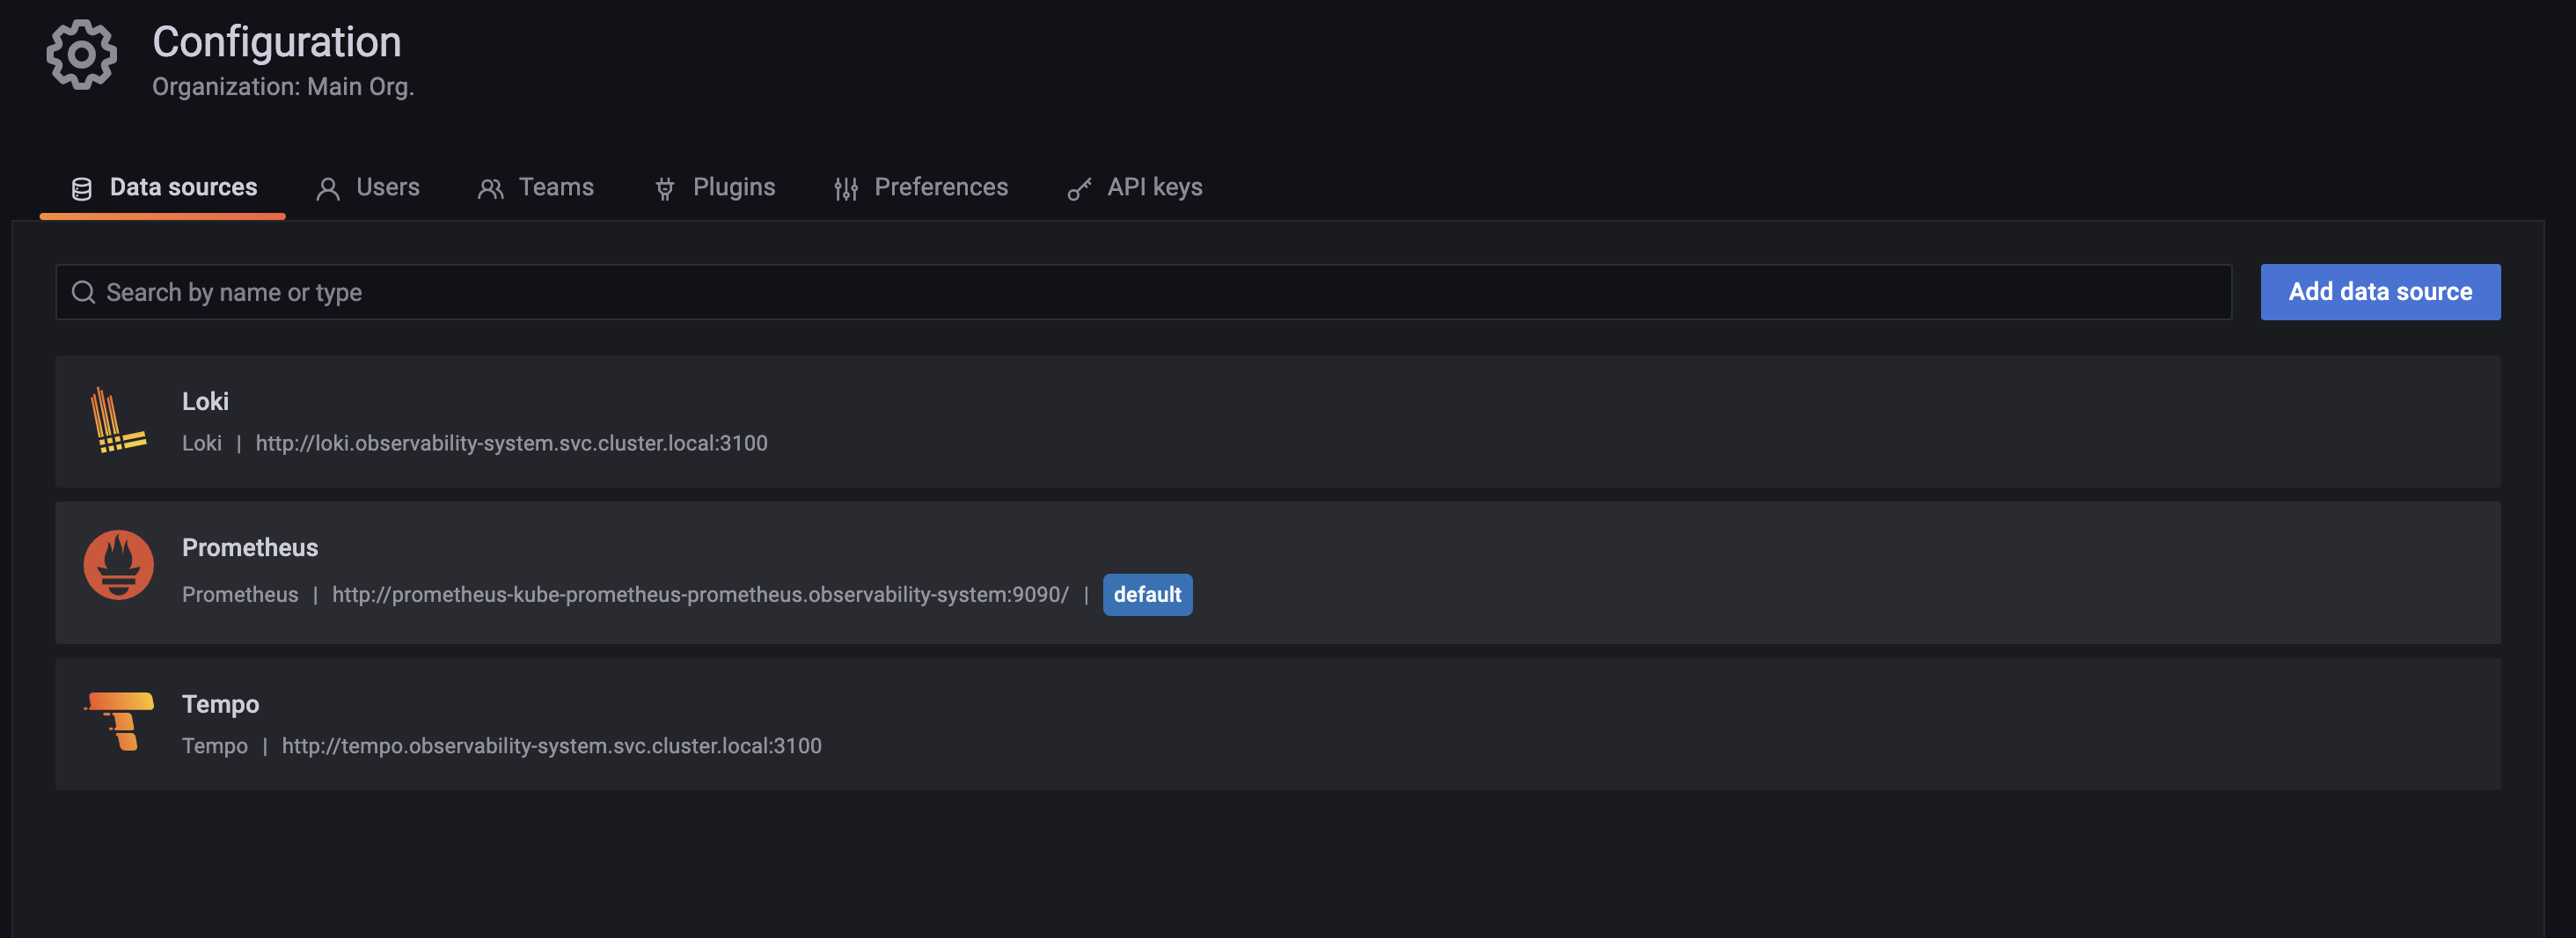
Thirdly, we configured Loki, which is responsible for logs, as an additional datasource for Grafana and also specifying the url as http://loki.observability-system.svc.cluster.local:3100 because thats where our loki service runs from. We also have to extract TraceID from the logs using the regex ((\d+|[a-z]+){5}(\d+|[a-z]+){5}(\d+|[a-z]+){4}) The datasourceUid: tempo configuration allows us to link it to Tempo, that is if we can extract a TraceID base on the regex. Loki also has promtail automatically enabled because its default value is set to true in the helm chart, loki-stack. Promtail sets up a deamonset to allow loki access the logs.
Now, that we have the visual aspect(Grafana), metrics (Prometheus), logs (Loki) covered, we need to configure tempo for out traces. Which is basically the service http://tempo.observability-system.svc.cluster.local:3100.
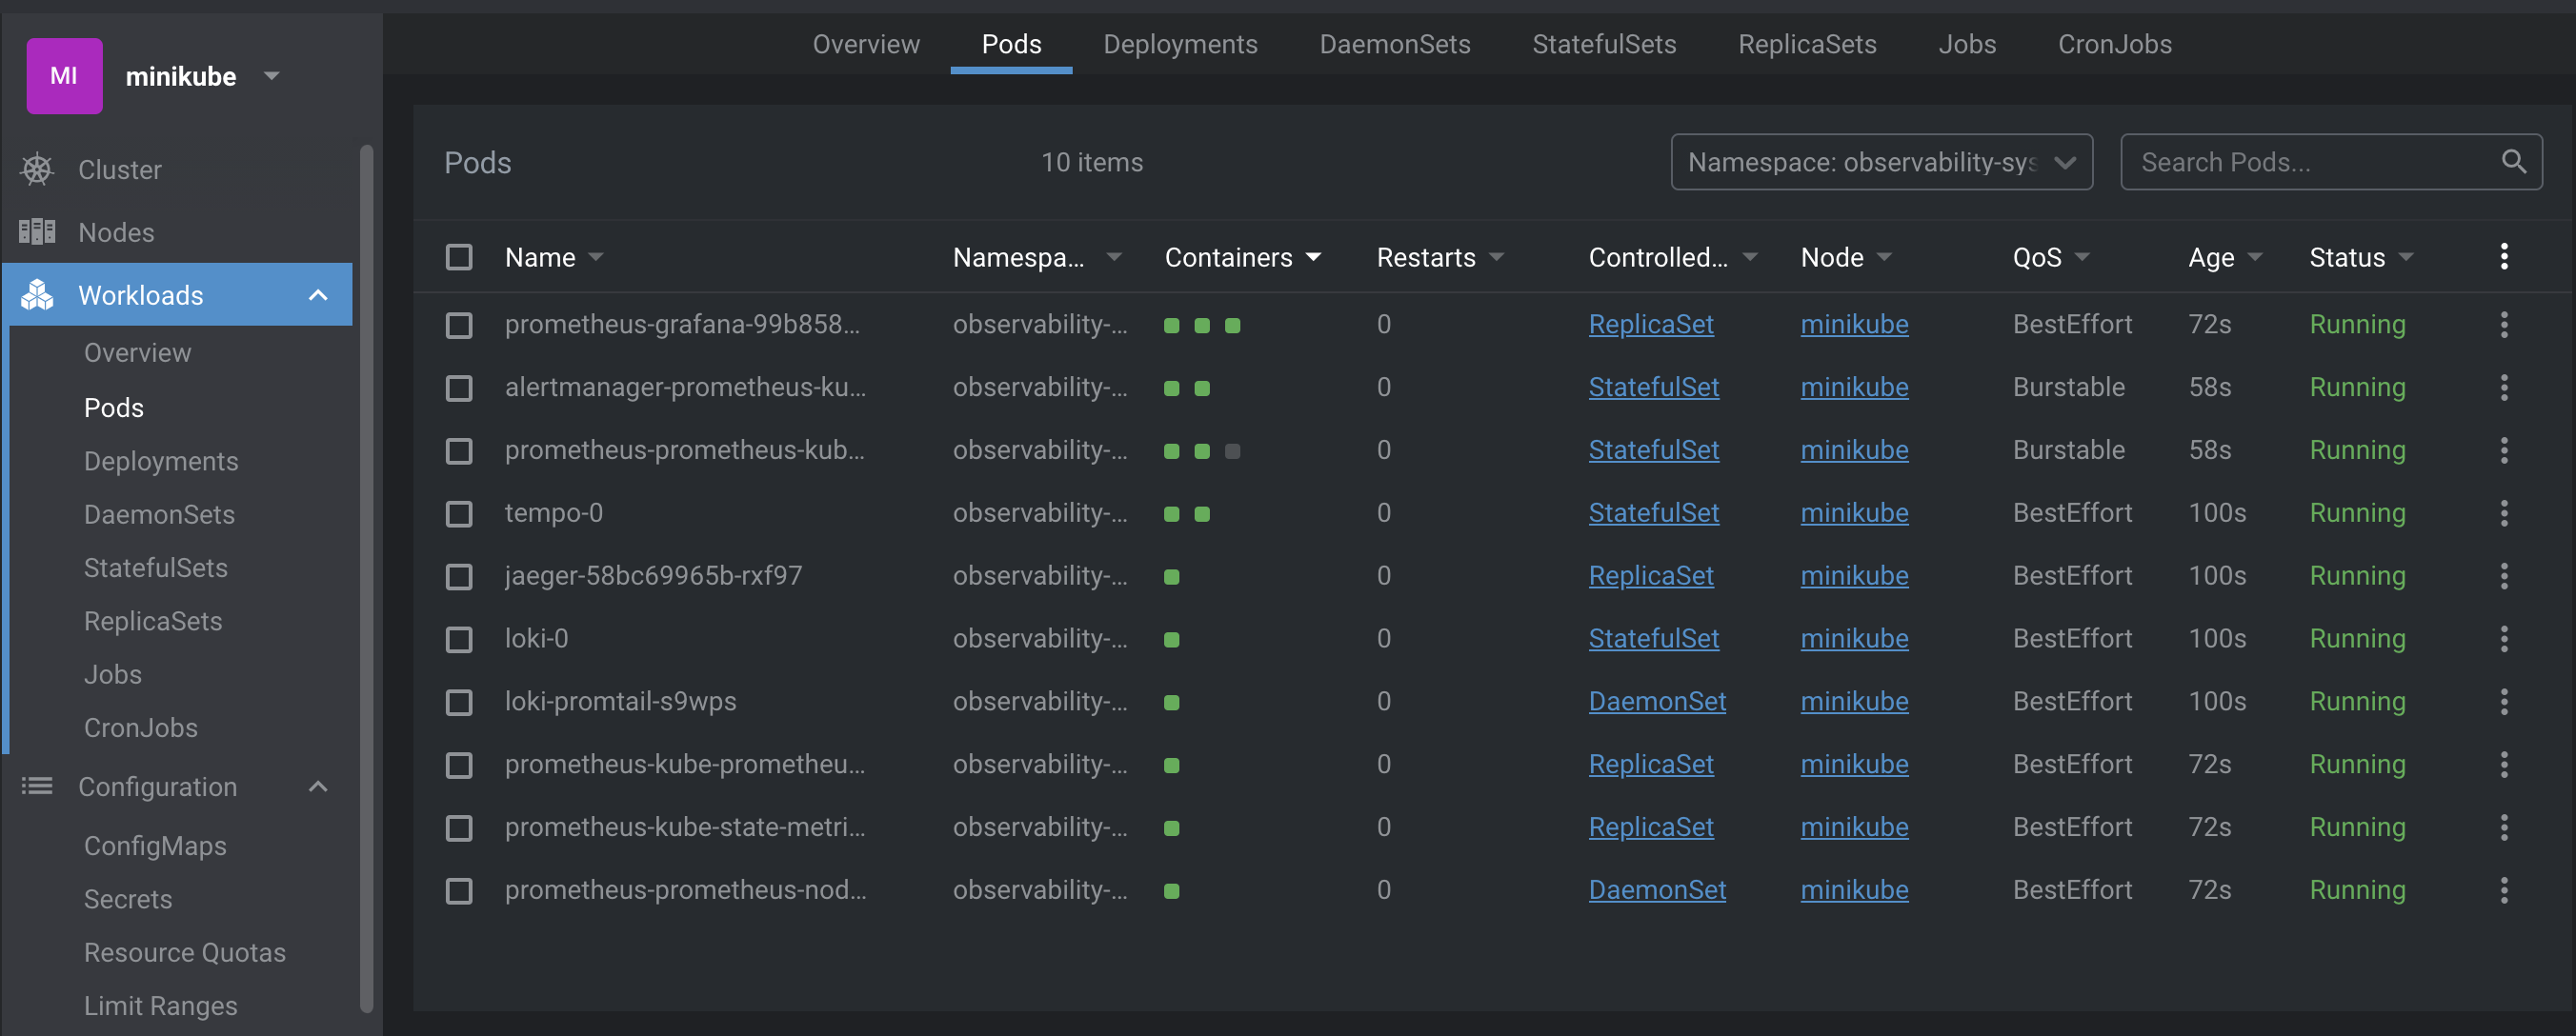
Putting everything together, our set up should be running succesfully on minikube like below:
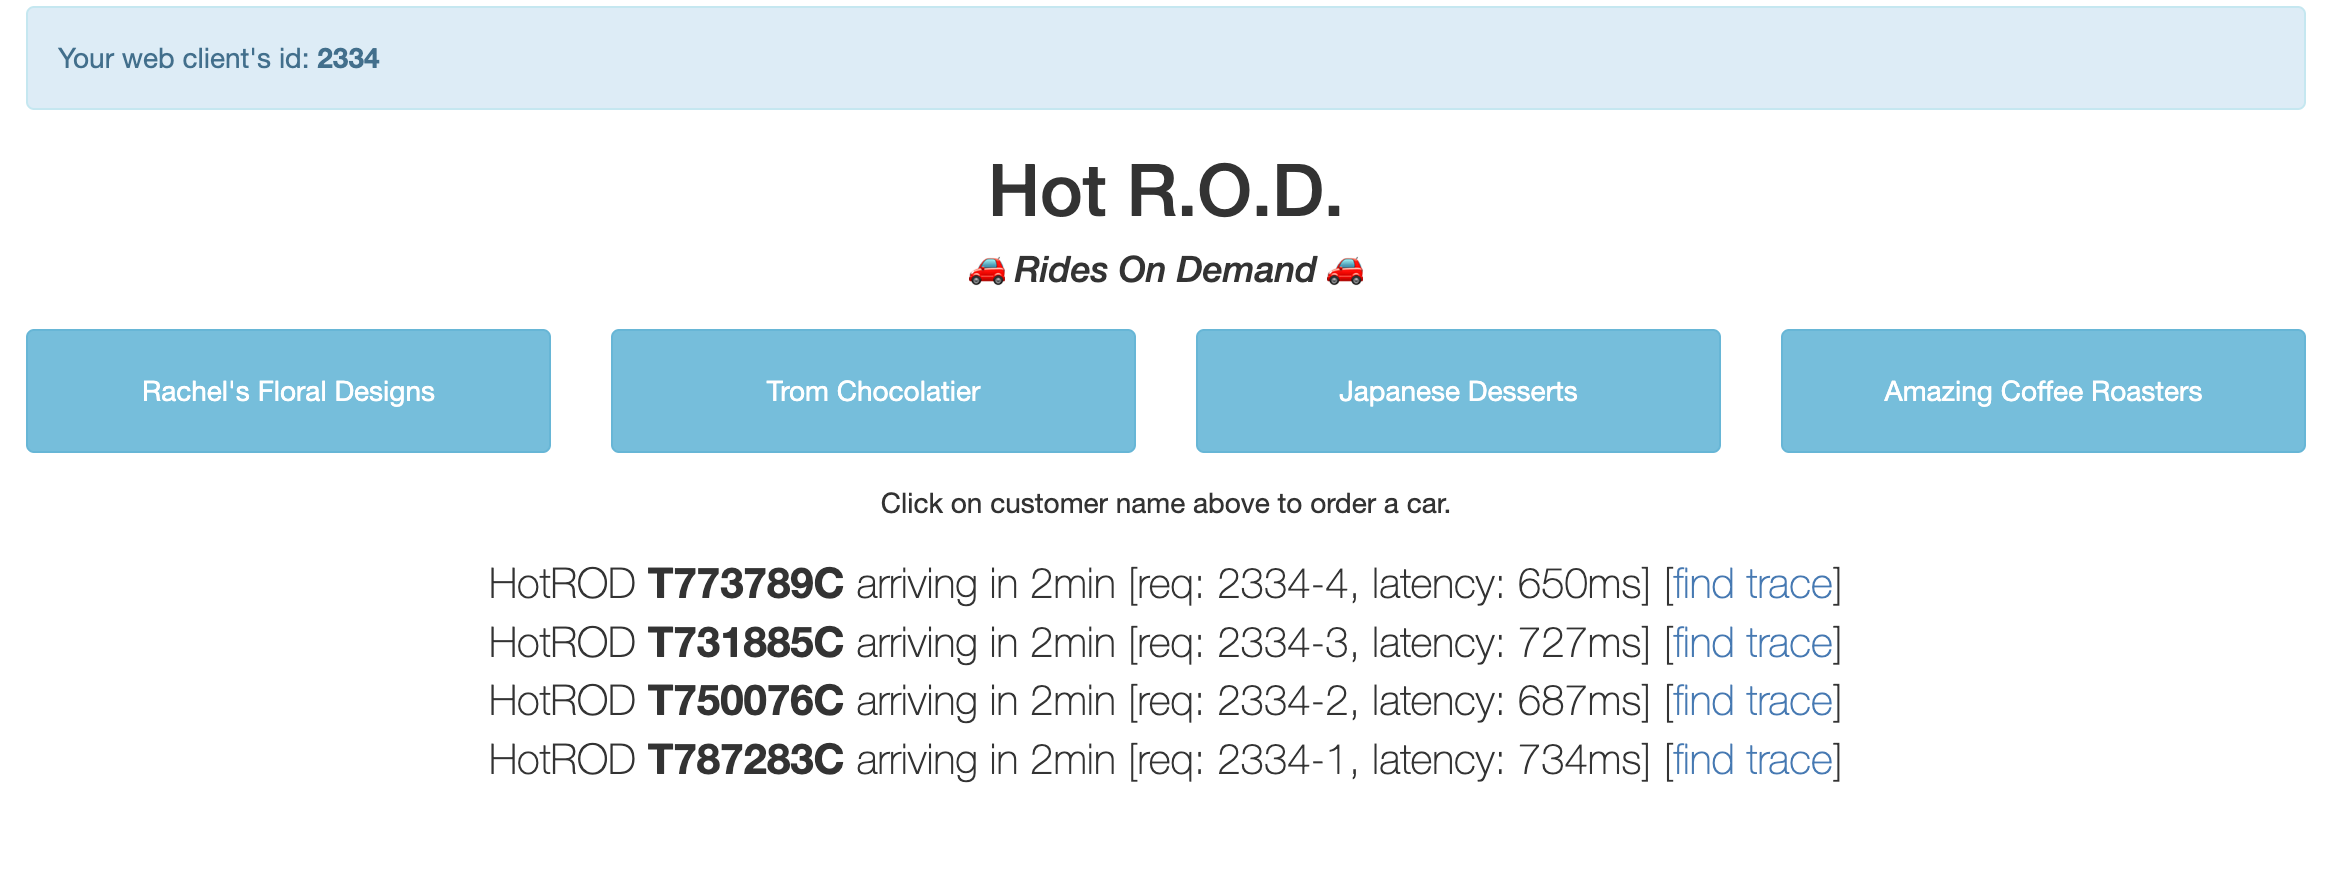
Now that everything is running, we need to set up a sample app to use the Observability stack. That is where the hotrod app by jaegar comes in.
- Run
make deploy-sample-appto set up hotrod. It deployment manifest looks at this, and instead of using Jaeger for Distributed Tracing, it rather uses Tempo.tempo.observability-system
1
2
3
4
5
6
7
8
9
10
11
12
13
14
15
16
17
18
19
20
21
22
23
24
25
26
27
28
29
30
31
32
33
apiVersion: apps/v1
kind: Deployment
metadata:
  labels:
    app: hotrod
  name: hotrod
spec:
  replicas: 1
  selector:
    matchLabels:
      app: hotrod
  template:
    metadata:
      labels:
        app: hotrod
    spec:
      containers:
        - args:
            - all
          env:
            - name: JAEGER_AGENT_HOST
              value: tempo.observability-system
            - name: JAEGER_AGENT_PORT
              value: '6831'
            - name: JAEGER_SAMPLER_TYPE
              value: const
            - name: JAEGER_SAMPLER_PARAM
              value: '1'
          image: jaegertracing/example-hotrod:latest
          name: hotrod
          ports:
            - containerPort: 8080
      restartPolicy: Always
This works out of the box. We can confirm this by generating random events on the hotrod service and see how the observability stack reacts to it.
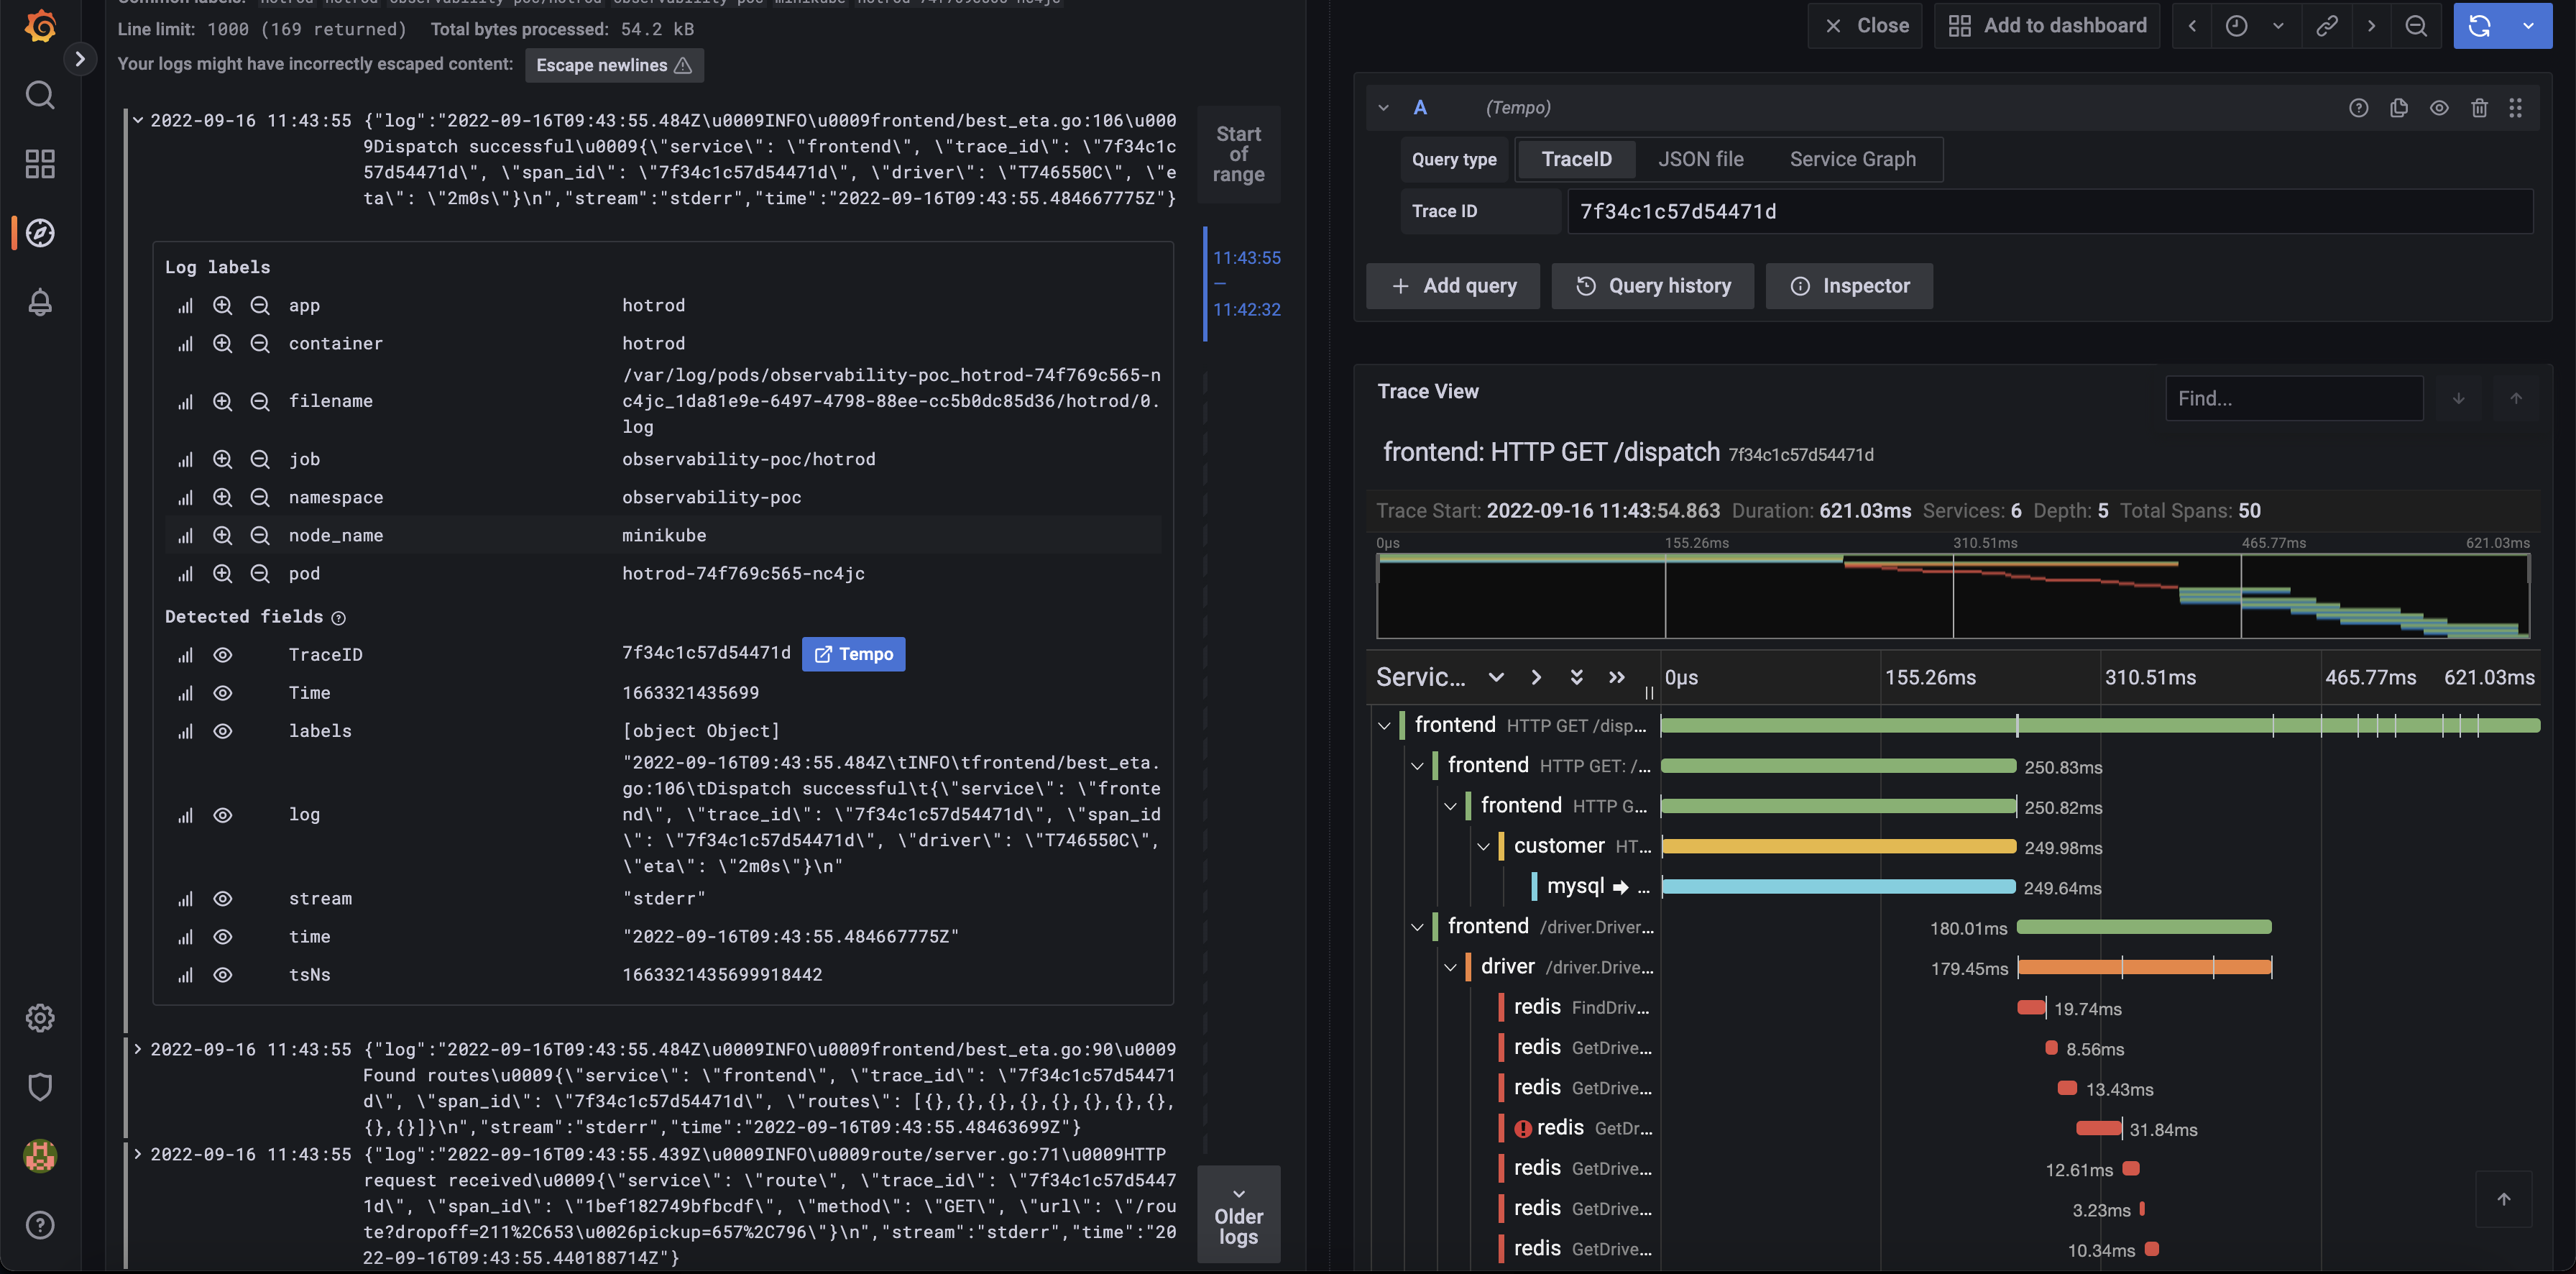
We can also see the link between logs in Loki and using the traceID see how it relates to traces in Tempo.
And we can also switch to prometheus to see metrics for our hotrod sample app.
Conclusion
To summarize everything,
i. Observability is important.
ii. Its importance to not treat the telemetry types as silos as they may be related in one way or the other.
iii. How to build a simple observability stack.
iv. How to use Tempo for Distributed Tracing.
v. Using Loki and promtail for logs.