
1. What’s Distributed Tracing?
Assume you’ve designed your application using a microservice architecture and for a feature like signup you have:
a. service that creates the user in the database,
b. …another service that send an event to a messaging queue,
c. and finally a service to send an email to the user reacting to the event created in the messaging queue.
FYI this is just signup. (BTW I don’t recommend starting a project like this unless it’s an already existing project you’ve decided to break apart but I’ll leave that for another day).
Monitoring can be a problem since requests can propagate between multiple services, probably running on different containers/hosts. In a “pure” microservice system the services might not even be sharing resources like database. How then can we explain or know that although Kofi Mensah’s account details were successfully created by the signup service, the emailing service failed to send an email to Kofi Mensah without having to grep through multiple log files across different hosts. With this particular example it’s not that our emailing service stopped working or wasn’t running, it just didn’t send email to Kofi Mensah but probably sent an email to another user after.
This is where distributed tracing comes in. As a request propagates between multiple services it leaves a trace which can be used to track the life cycle of the request.
Whats a trace?
A trace is just a record of how a request is propagated between services, the life cycle of a request. This is normally a collection of spans depending on the journey of the request. A span is the smallest unit in distributed tracing, it normally consists of an id,parent id to indicate if span is connected to another and tags to give more information on the span and other meta data.
There are so many tools for recording and visualizing traces , eg Jaeger, OpenTracing, Opencensus etc.. but this post is focused on two of them, Opencensus and Spring Cloud Sleuth and how to visualize trace data in Kibana and Zipkin.
Zipkin is a distributed tracing system. It helps gather timing data needed to troubleshoot latency problems in microservice architectures. It manages both the collection and lookup of this data. Zipkin’s design is based on the Google Dapper paper
Added to these, Zipkin also has a Rest API, two version of it v1 and v2. This makes Zipkin a polyglot server for visualizing traces and effectively see the intercommunication of your services. Hard to find a language that doesn’t support REST.
But what if we want more, for example visualize more data from traces and understand little more of our services in production that we can’t get from logs. This is where the ELK stack comes in. The ELK stack is really awesome and if you don’t know about it you can read more on it with a Google search.
Since the goal of this post is to find ways to understand traces for your system, I’ll show how to use two distributed tracing libraries to send trace data to Zipkin and the ELK stack.
The sample applications would help us understand what each library,that is Sleuth and Opencensus, give us and how sending the trace to Zipkin and/or ELK can help us understand our distributed systems in production and the value each framework brings to the overall goal.
2. Distributed Tracing tools
a. Using Spring Cloud Sleuth
For Java/Kotlin projects using the Spring stack it should be quite easy to get started with this. Since this requires almost nothing to get it started with. You can check out the sample project from github.
My reason for picking Spring Cloud Sleuth is the simplicity. It requires almost nothing to set it up and once you have the dependency as part of your project it automatically does the tracing for you.
The dependency which you can find below:
1
2
3
4
<dependency>
    <groupId>org.springframework.cloud</groupId>
    <artifactId>spring-cloud-starter-sleuth</artifactId>
</dependency>
b. Using Opencensus
This an opensource distributed tracing tool started Google.
The reason I picked this was in as much as the “magic” that Spring Cloud Sleuth is, there might be certain uses magic won’t work and also one that is not dependent on the Spring stack and not only limited to the JVM. This is where Opencensus comes in.
4. Why an Elasticsearch Trace Exporter
I love the ELK stack. I’ve used all or parts of it for operational analysis, data analytics,data lake,data warehouse, data prediction in different projects. I’ve actually written some FOSS projects for Elasticsearch as well.
One of the ways I love to work on FOSS projects is that at the end of it all, I want anyone to be able to use a combination of my opensource projects. So I try to find ways to link all the FOSS projects I work on.
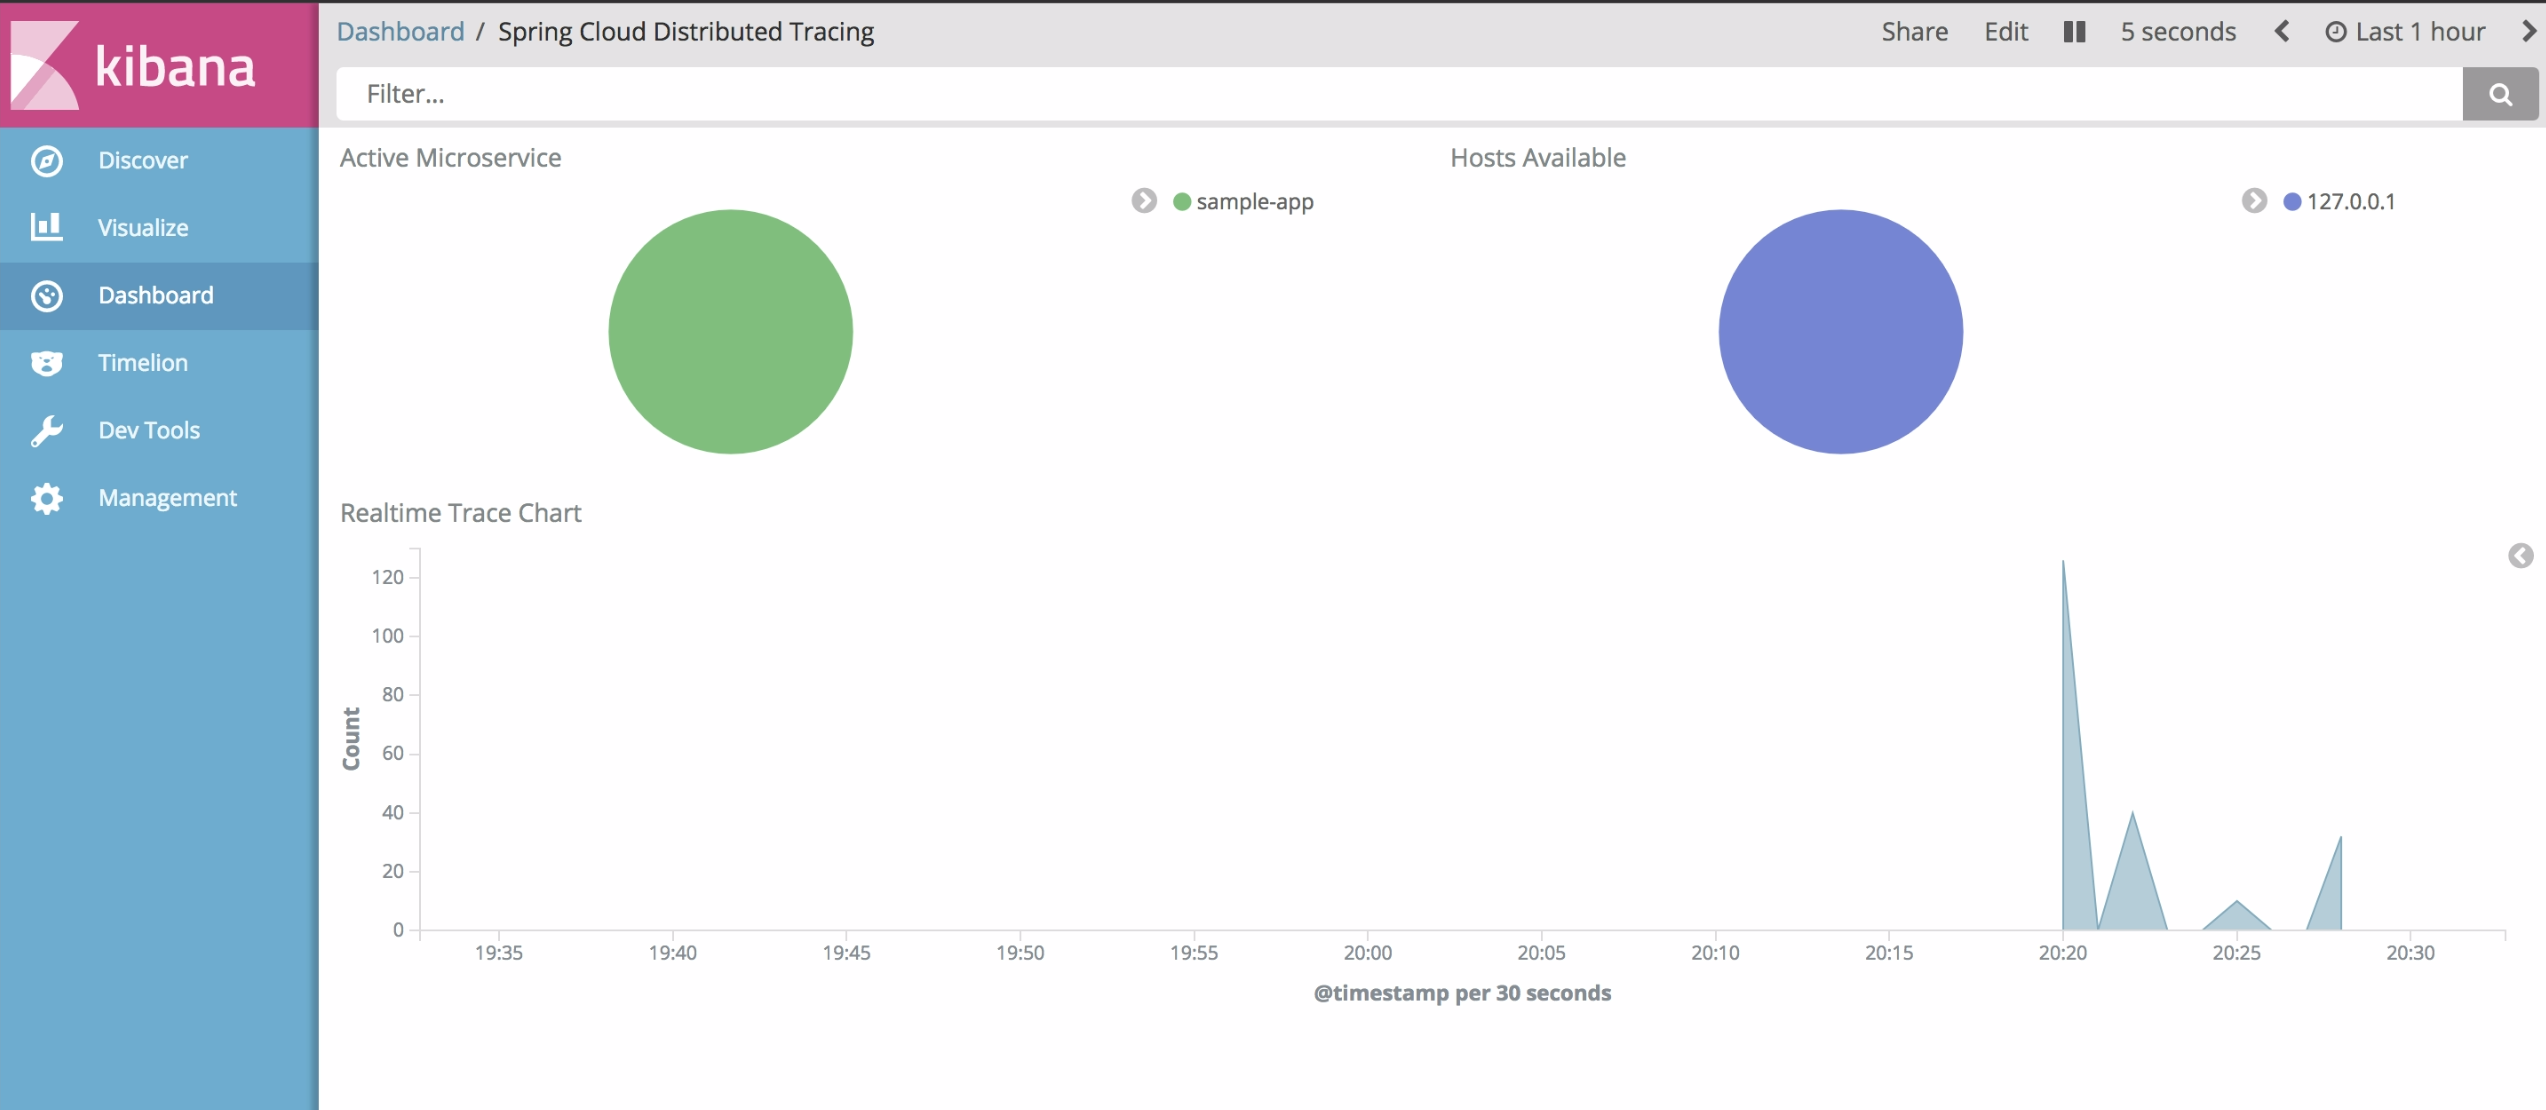
I picked Elasticsearch based on my past experience with it, Kibana gives us so much power to visualize the data in Elasticsearch and some of the FOSS projects I’ve worked on which when put together can enable someone generate trace data reports pdf,csv or html, configure alerts based on certain metrics via sms,email and api and also build an ML algorithm on trace data to predict performance of your services.
From the FOSS links you can tell some of them are still in progress but you get the idea connecting them.
The best reason of all is search. Being able to search traces to know why a service request took 20 secs on Monday 21st September at 3:43 PM for Kofi accessing the service from Tokyo rather than the 5 seconds we have as SLA for response time. This possible with Elasticsearch.
a. Spring Cloud Sleuth Elasticsearch Exporter *
Spring Cloud Sleuth doesn’t support exporting to Elasticsearch. So this might be a little confusing. To send trace data from a Spring Boot project to the ELK stack would require Logstash. The “L” in the ELK.
Logstash is an open source, server-side data processing pipeline that ingests data from a multitude of sources simultaneously, transforms it, and then sends it to your favorite “stash.”
In our case the stash is Elasticsearch. You can find the logstash config we used for our sample project here. A simple config that sends logs in a particular format to logstash running on 127.0.0.1 port 5000 from the config file.
b. Opencensus Elasticsearch Exporter
Opencensus doesn’t have an Elasticsearch exporter either. I’ve worked on and submitted a PR to the Opencensus team. Once it gets accepted and released you can find more details on it under the exporters in Opencensus.
For now you can check out on my personal github for the Elasticsearch exporter I wrote for Opencensus.

5. Why an Zipkin Trace Exporter
Spring Cloud has a simple way of starting a Zipkin server. This is actually based on OpenZipkin which originated from Twitter.
Using it is as simple as using the annotation @EnableZipkinServer on our main class. From the Spring Cloud Zipkin documentation:
The Zipkin Server delegates writes to the persistence tier via a SpanStore. Presently, there is support for using MySQL or an in-memory SpanStore out-of-the-box. As an alternative to REST, we can also publish messages to the Zipkin server over a Spring Cloud Stream binder like RabbitMQ or Apache Kafka. We’ll use this option, and org.springframework.cloud:spring-cloud-sleuth-zipkin-stream’s @EnableZipkinStreamServer, to adapt incoming Spring Cloud Stream-based Sleuth Spans into Zipkin’s Spans and then persist them using the SpanStore.
This is really cool especially if you’re the type that’s really strict on “REST intercommunication between internal services is bad” or just prefer TCP to HTTP for recording traces.
a. Spring Cloud Sleuth Zipkin Exporter
To get our sample Spring Cloud Sleuth to send trace data to Zipkin is just to add this line in our properties file
1.Where our zipkin server is located
1
spring.zipkin.baseUrl=http://localhost:9411
2.To enable this functionality in our app and also make sure we have this dependency
1
2
3
4
<dependency>
    <groupId>org.springframework.cloud</groupId>
    <artifactId>spring-cloud-sleuth-zipkin</artifactId>
</dependency>
There’s also another configuration to check the percentage of data we send to zipkin. The default is 10%. If you want 50% just add this to your properties file. Note that although it is a percentage, the accepted value is a double between 0.1 to 1.0 where 0.1 is 10%.
1
spring.sleuth.sampler.probability=0.5
If you’re already on Spring Boot 2.0 you can also use annotations to create our own spans. You can find an example of this usage on github and also read more on it here. This requires these dependencies or later:
1
2
3
4
5
6
7
8
9
10
<dependency>
    <groupId>org.springframework.cloud</groupId>
    <artifactId>spring-cloud-starter-sleuth</artifactId>
    <version>2.0.0.M9</version>
</dependency>
<dependency>
    <groupId>org.springframework.cloud</groupId>
    <artifactId>spring-cloud-sleuth-zipkin</artifactId>
    <version>2.0.0.M9</version>
</dependency>
b. Opencensus Zipkin Exporter
The team at Opencensus already wrote a zipkin exporter with an example on how to export trace data with it. You can find the documentation and codes here.
Hopefully with this post I hope you can appreciate what each library gives us and the part Zipkin and ELK stack play in visualizing traces in a distributed system and can help you make a decision with the attached sample project.

Codes are available on github
REFERENCES
http://microservices.io/patterns/observability/distributed-tracing.html