1. Kubernetes [K8S]
The Processes factor of 12 factors which means having stateless services, that can be easily scaled by deploying multiple instances of the same service. Deploying and management multiple instances of these stateless services can be a challenge if not organized properly. Coupled with features like load balancing, monitoring/health checks, replication, auto scaling and being able to roll updates with little overhead.
This is where Kubernetes comes in. Kubernetes is an open-source system for automating deployment, scaling, and management of containerized applications
A Kubernetes setup consists of several parts some mandatory for the whole system to function.
Components
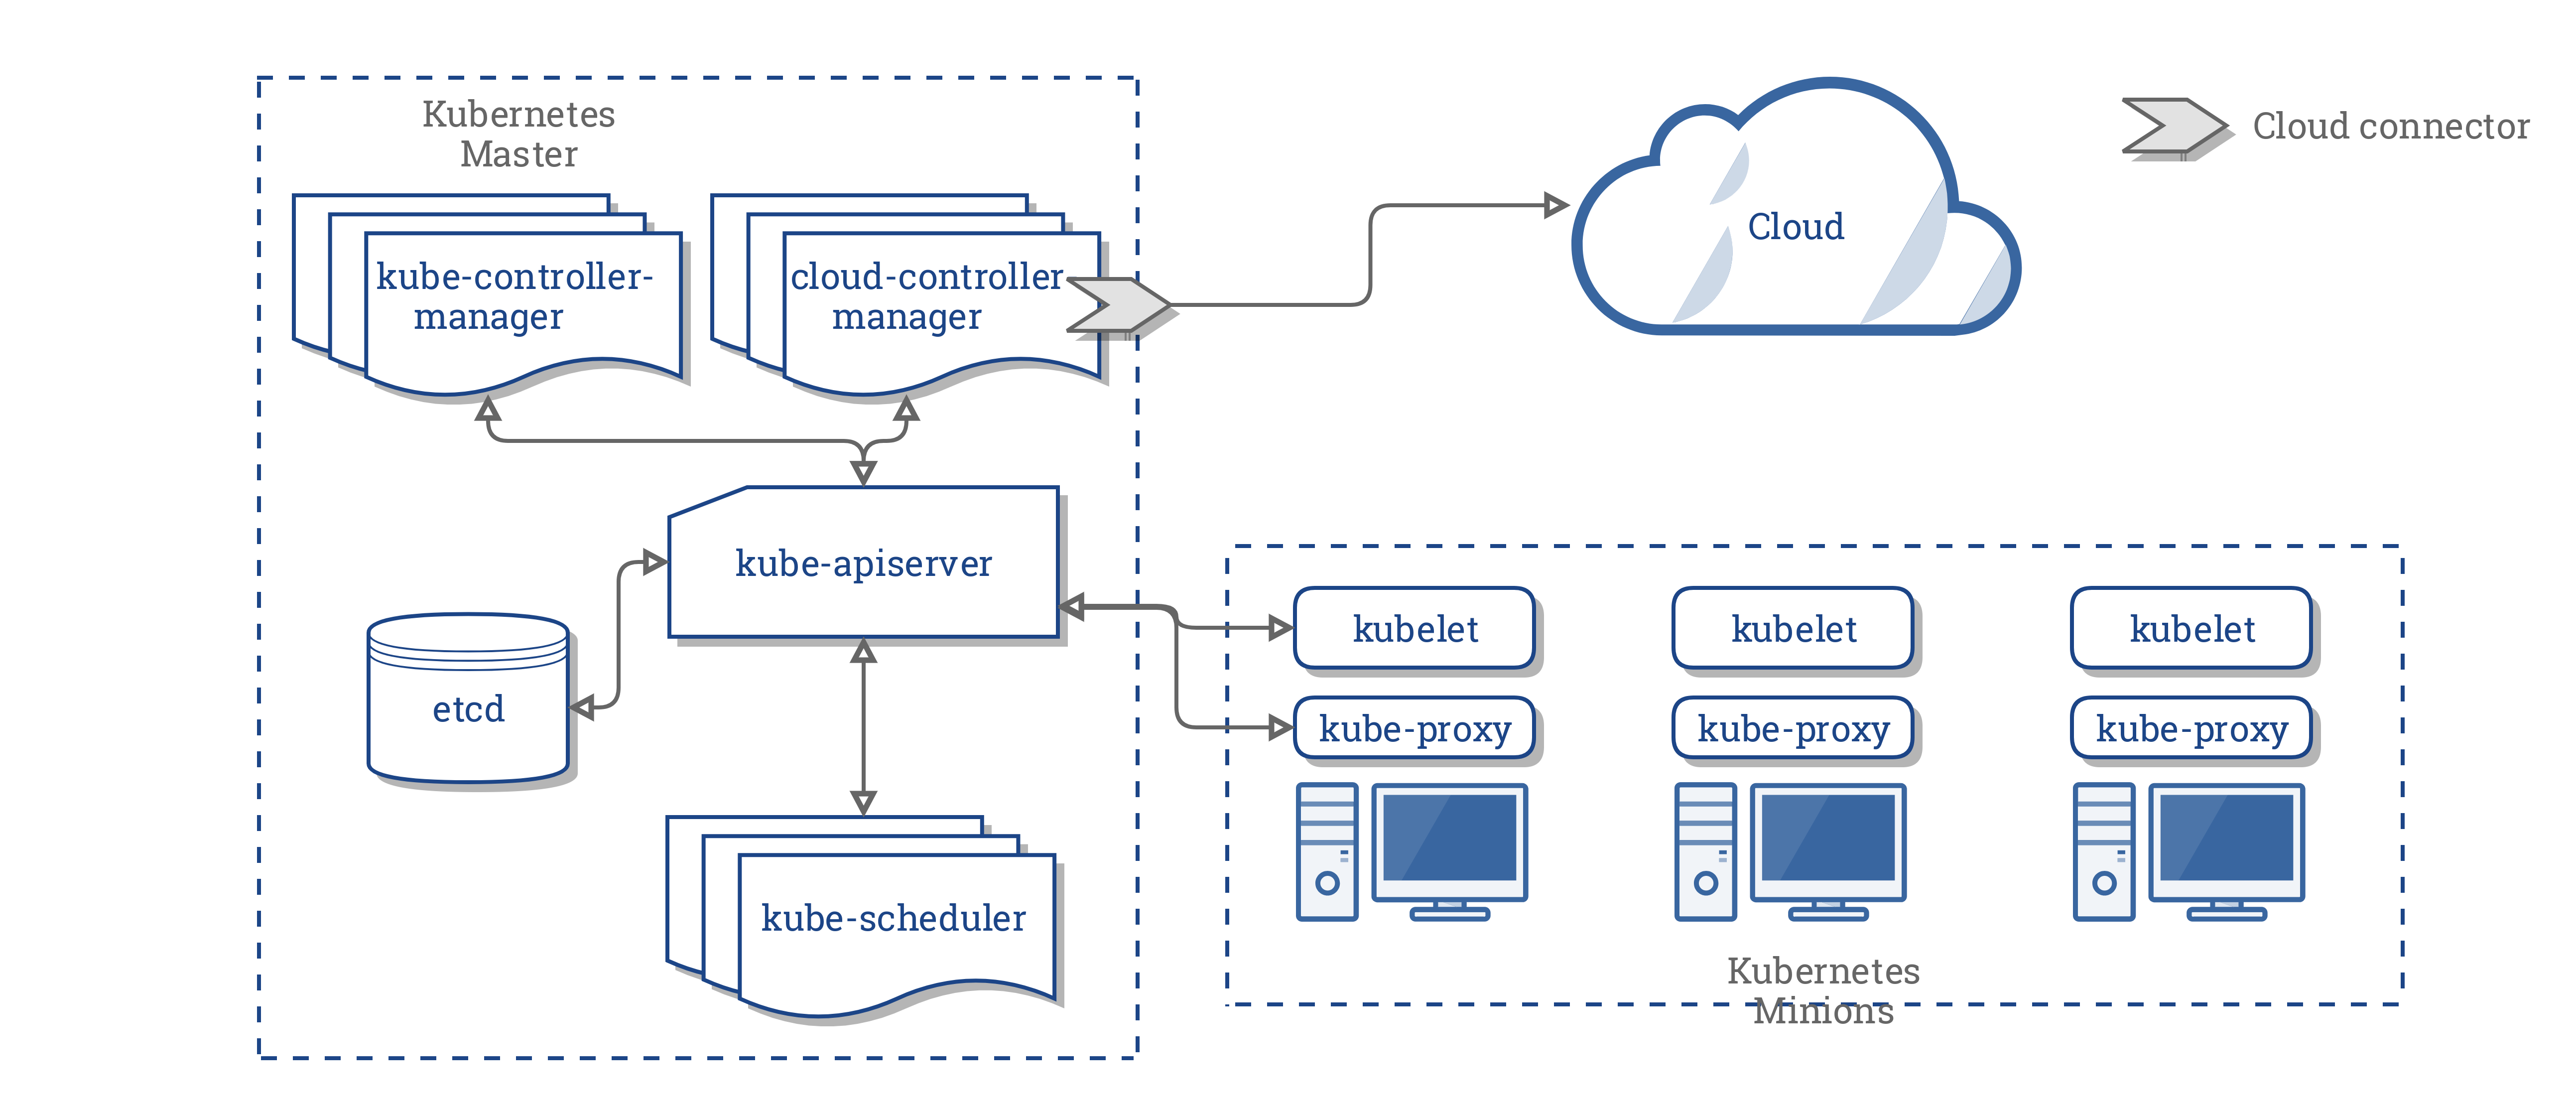
https://kubernetes.io/docs/concepts/architecture/cloud-controller/
Kubernetes Master or Master Node This is responsible for managing the cluster. This the cluster’s control plane, responsible for orchestrates the minions.
kube-apiserver [Kubernetes Master] This is the part of the Kubernetes Master that is provides API for all the REST communication used to control the cluster.
etcd storage [Kubernetes Master] Simple HA key-value store for storing configuration and cluster data.
kube-scheduler [Kubernetes Master] This is responsible for deploying configured pods and services onto the nodes.
kube-controller-manager [Kubernetes Master] This uses apiserver to watch the shared state of the cluster and makes corrective changes to the current state to change it to the desired one. That is to noticing and responding when nodes go down or maintaining the correct number of pods of cluster.
cloud-controller-manager [Kubernetes Master] This is a new feature which runs controllers that interact with the underlying cloud providers. Allowing cloud vendors code and the Kubernetes core to evolve independent of each other.
Kubernetes Minions or Worker Node These contains the pod and all necessary services to ensure the pods function properly.
kubelet [Kubernetes Minions] An agent that runs on each node in the cluster. It gets the configuration of a pod from the kube-apiserver and ensures that the described containers are up and running.
kube-proxy [Kubernetes Minions] It’s responsible for network routing. Basically a proxy.
Container Runtime [Kubernetes Minions] The responsible for running containers. It supports Docker and other containers but most use cases are with docker.
Other things to know although not shown in the diagram are :
Pod A pod is when a single or multiple containers are wrapped and abstracted so it could be deployed in Kubernetes. They normally don’t live long and in the coming section under deployments, you’ll se how pods can be created and deleted.
Service This is an abstraction on top of a number of pods, typically requiring to run a proxy on top, for other services to communicate with it via a Virtual IP address.This is where you can configure load balancing for your numerous pods and expose them via a service.
Deployment Configuration
Pod and Services can be created separately but a deployment configuration combines pods and services with extra configuration to show how pods should be deployed, updated and monitored. These different ways to configure deployments on Kubernetes each has their pros and cons. There’s a link in the references that shows the pros and cons of each deployment.
But toi summarize briefly:
i. Recreate: This will end the old version and recreate the new one. Mostly suitable for dev environments or new uat environments. sample config
ii. Ramped: This type of deployment releases a new version one after the other by creating secondary replica sets of new pods and removing the old pods till the exact configuration sample config
iii. Blue/Green: This involves deploying the new one alongside the old one. Labeled as “blue” and “green”. After testing the new one and seeing that it meets requirements, we switch traffic. sample config
iv. Canary: This is almost like the Blue/Green Deployment but the main difference is you release the services to a set of users first. It’s easier to implement with service mesh like Istio and Linkerd. sample config
Setting up Kubernetes
Some of the ways to run :
a. Local-machine
i. Minikube is the recommended method for creating a local, single-node Kubernetes cluster for development and testing. Setup is completely automated and doesn’t require a cloud provider account.
ii. Docker Edge Docker for Mac 17.12 CE Edge includes a standalone Kubernetes server and client, as well as Docker CLI integration. The Kubernetes server runs locally within your Docker instance, is not configurable, and is a single-node cluster. However this is only for local testing.
b. Hosted
i. Google Kubernetes Engine offers managed Kubernetes clusters.
ii. Amazon Elastic Container Service for Kubernetes offers managed Kubernetes service.
iii. Azure Kubernetes Service offers managed Kubernetes clusters.
Interfacing your Kubernetes Cluster
kubectl : A cli tool to communicate with the API service and send commands to the master node.
Web UI (Dashboard): A general purpose dashboard that allows users to manage and troubleshoot the cluster and it’s applications.
2. Service Mesh
Service meshes like Istio, Linkerd and Traefik do not come with Kubernetes out of the box and but I’ll like to take a minute to talk about Service Mesh and then we can see the role it plays in our kubernetes cluster.
First of all, let’s start with the default service resource in Kubernetes. If you’ve read up to here you have a basic understanding of how the service resource works. With some of it benefits as Service discovery, Load balancing. Although all these please play vital roles there are certain fallbacks.
Take for instance the LoadBalancing feature of a service resource that’s in front of 2 instances of a pod,A and B. Unfortunately Pod A is not performing very well the Service resource will still forward request to Pod A. A good service mesh will monitor the response rate’s of the pods and based on their response will know how to forward the response to the pods. With other functionalities like forwarding request based on http header, we are able to get a smart load balancer that can forward request based on latency. Using the http headers we can have the Canary type of deployment. For example deploy a pod for all users in a particular region on a particular device based on the http headers.
Other advantages of service mesh include distributed tracing, circuit breaking. This is done with no development. This level of abstracting distributed tracing,circuit breaking from the microservice into the service mesh makes them easy to use aside it’s other benefits.
For this project,we’ll be using Istio. Istio is built on top onf Envoy, which is used as the data plane or sidecar proxies to the pods. The other part, the control plane, configures envoy to route traffic, Istio-Auth for service-to-service auth and user-to-service auth and telemetry using Mixer. One cool factor about Mixer is it’s support for different adapters. Eg: Prometheus, Datadog etc. This makes Istio very easy to use and for the preferable choice when it comes to Service Mesh.
3. Putting it altogether
Putting everything together ,I’ll create a cluster with a java, go microservices and an html frontend.
1. Building the docker image
If you read my post on using Travis CI to set up a CI pipeline, I’ll use the same setup but with a different configuration file to build docker containers for the services which will be automatically pushed to DockerHub. Any CI pipeline that can get your service packaged as docker container will also work.
2. Configuring the Pod Resource
If you followed step 1. you’ll have a docker image on uploaded to your private repo or DockerHub in our case. We then configure the Container Runtime to pick the docker images as pods.
Here’s a sample configuration explaining what it mean :
1
2
3
4
5
6
7
8
9
10
11
12
13
apiVersion: v1
kind: Pod
metadata:
  name: cloudnative-java-service
  labels:
    app: cloudnative-java-service
    version: cloudnative-java-service
spec:
  containers:
  - image: stmalike/java-service
    name: cloudnative-java-service
    ports:
    - containerPort: 8080
kind : Type of resource.
name : Name for resource
labels.app : Label for pod
spec : For a pod config, this accepts an array of containers to be run in a single pod.
image : Details about the image to be run in pod.
resources : CPU and memory resource limits for pod
This is a simple example to configure your pod but you can do more
Now the Container Runtime in the kubernetes cluster has 3 pods configured to pick docker images from DockerHub.
frontend pod,java microservice pod and go microservice pod.
Finally we register our pods:
1
kubectl create -f ./java-service/java-service-pod.yaml
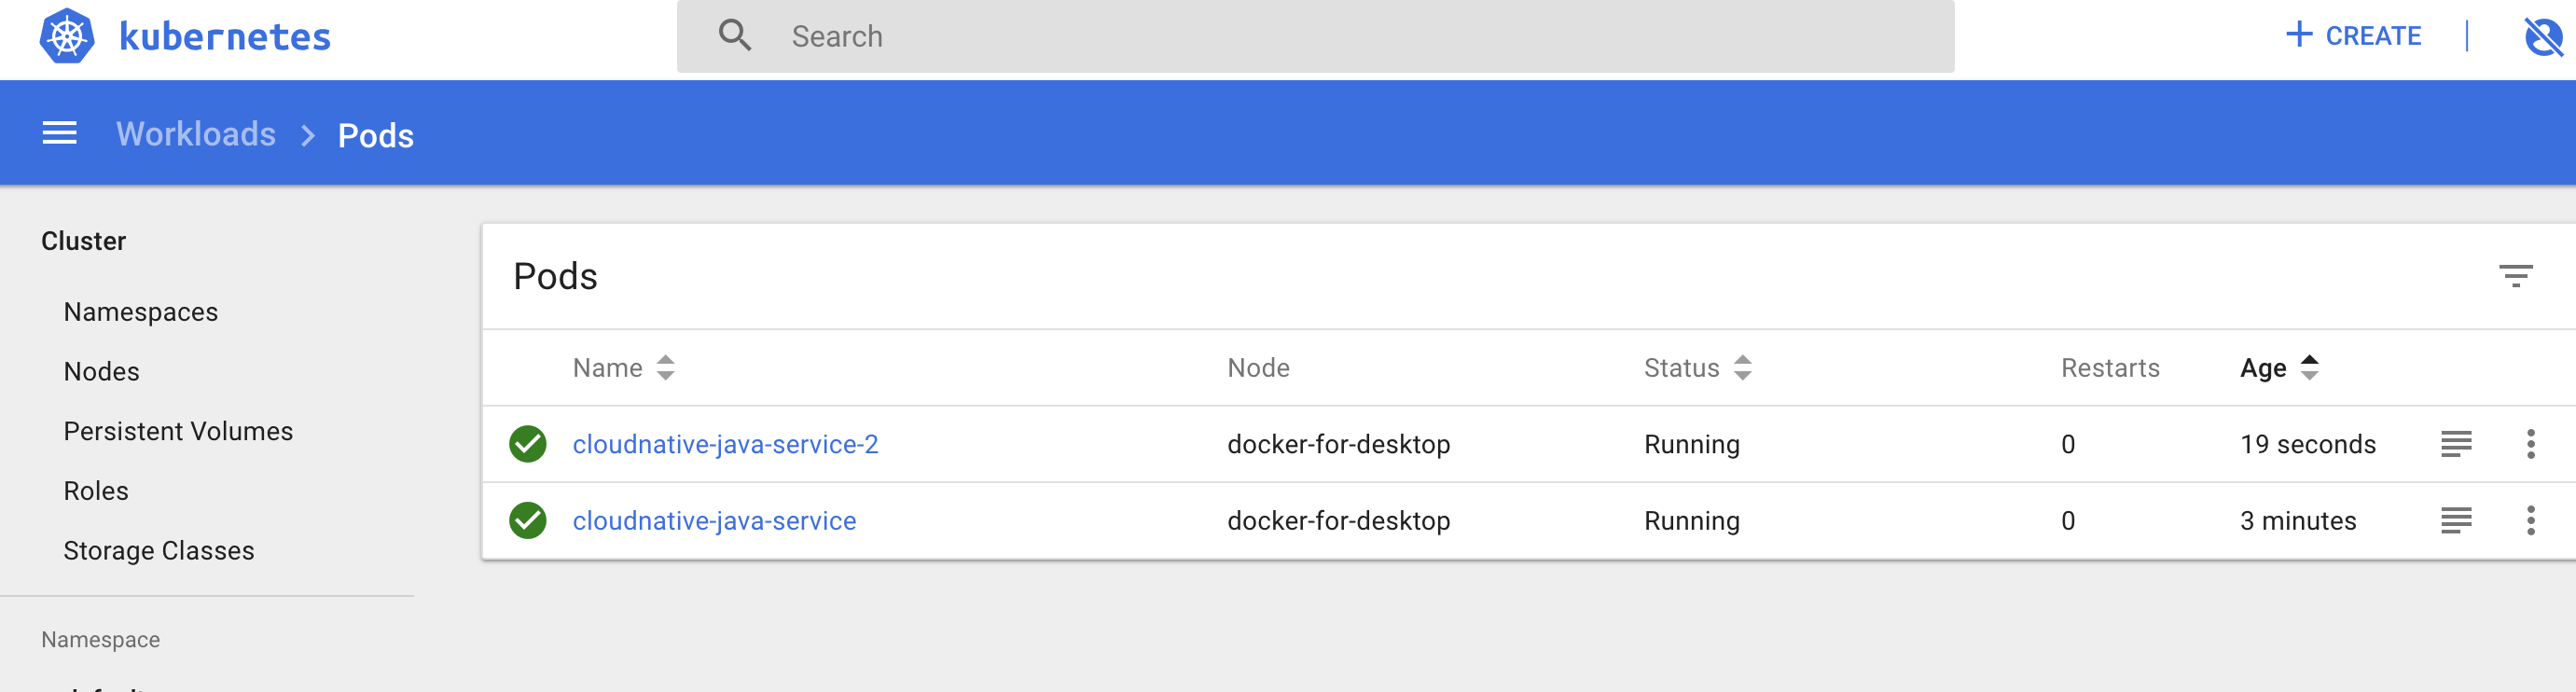
Now let’s verify our pods were created successfully.
1
kubectl get pods --show-labels

3. Configuring Config Map
At this point we’ve successfully gotten our microservices running in a pod. Next step we want a centralized place and secured place for our app configurations. In a previous post I shared the benefits of working with a configuration management service. The post highlighted how it could be done with Spring Cloud Config. Kubernetes also has a configuration servive we can use to achieve that called ConfigMap.
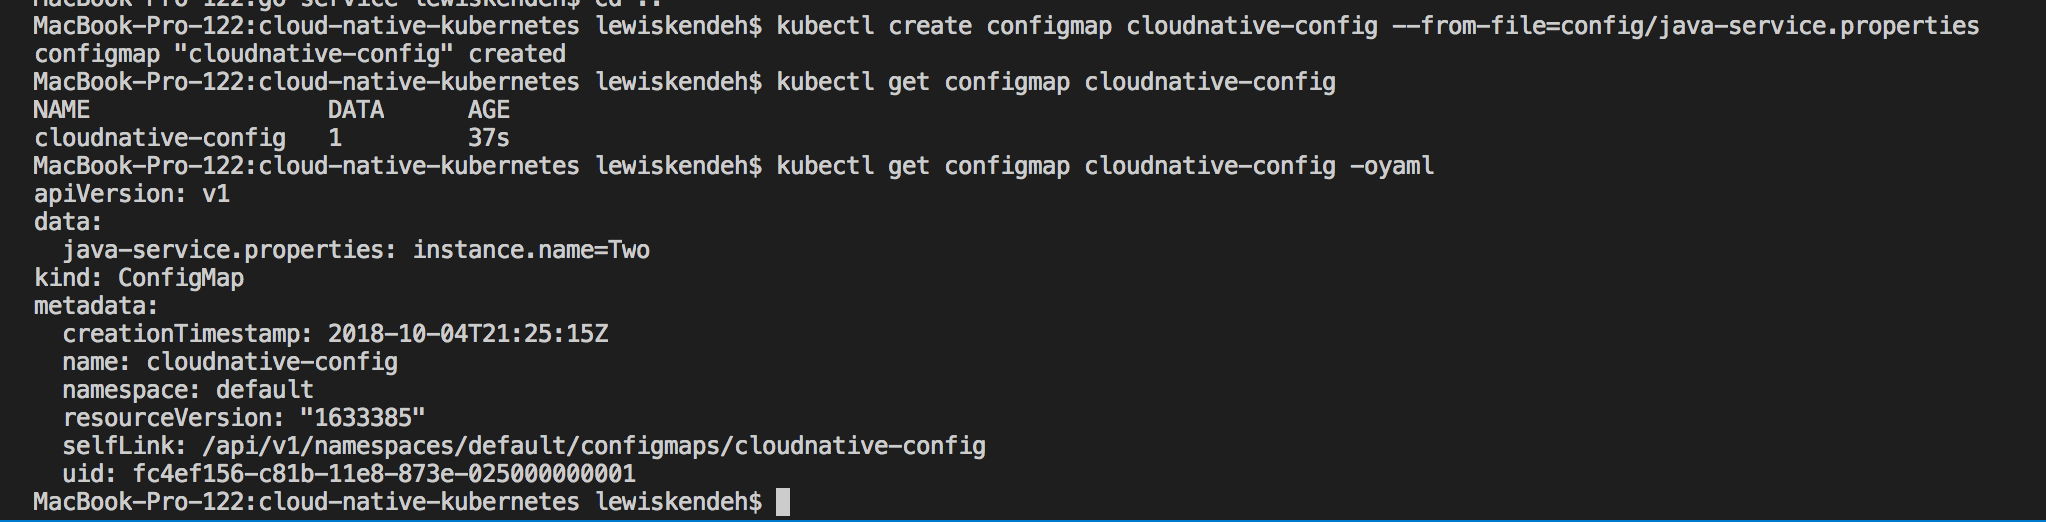
We can create a config server with the command below :
1
kubectl create configmap cloudnative-config --from-file=config/application.properties
Now that we’ve created a config, we need to configure the pods to know about ConfigMap to enable them load configurations.
1
2
3
4
5
6
7
8
9
10
11
volumeMounts:
          - name: cloudnative-config
            mountPath: "/config"
            readOnly: true
      volumes:
      - name: cloudnative-config
        configMap:
          name: cloudnative-config
          items:
          - key: application.properties
            path: application.properties
The configuration simply mounts a drive /config in the java-service docker container with the configuration file. Fortunately we just need a file application.properties in a folder named as config where our spring boot jar is for it to pick it automatically. The loading of thsi properties overrides the default configuration we have for instance.name to be Two. By this we’ve configured the java-service pod to load instance name from the configuration file. This is to help us run 2 different pods of the java-service with different property value for instance.name.
4. Configuring the Service Resource
At this stage, we’ve successfully configured the pods with our docker containers. We’ll need to create an API Gateway to access the pods. This is where the service resource comes in.
We’ll need to configure our service resource to work as a Load Balancer, when there are multiple instances of the same pod and also serve as the main entry point or api-gateway for pods of the same type. Kubernetes uses the label configuration to classify pods this helps the load balance know which of the pods are the same.
1
2
3
4
5
6
7
8
9
10
11
12
apiVersion: v1
kind: Service
metadata:
  name: cloudnative-java-service-lb
spec:
  type: LoadBalancer
  ports:
  - port: 80
    protocol: TCP
    targetPort: 80
  selector:
    app: cloudnative-java-service
kind : Type of resource.
name : Name for resource
port: Port of the service.
protocol: Protocol of the communication.
targetPort: The port exposed in the pod.
selector.app: Pod where requests should be forwarded.
Read more about services
To create the service execute the following command:
1
kubectl create -f ./java-service/java-service-lb.yaml
Now let’s verify that the load balancers are up and running.
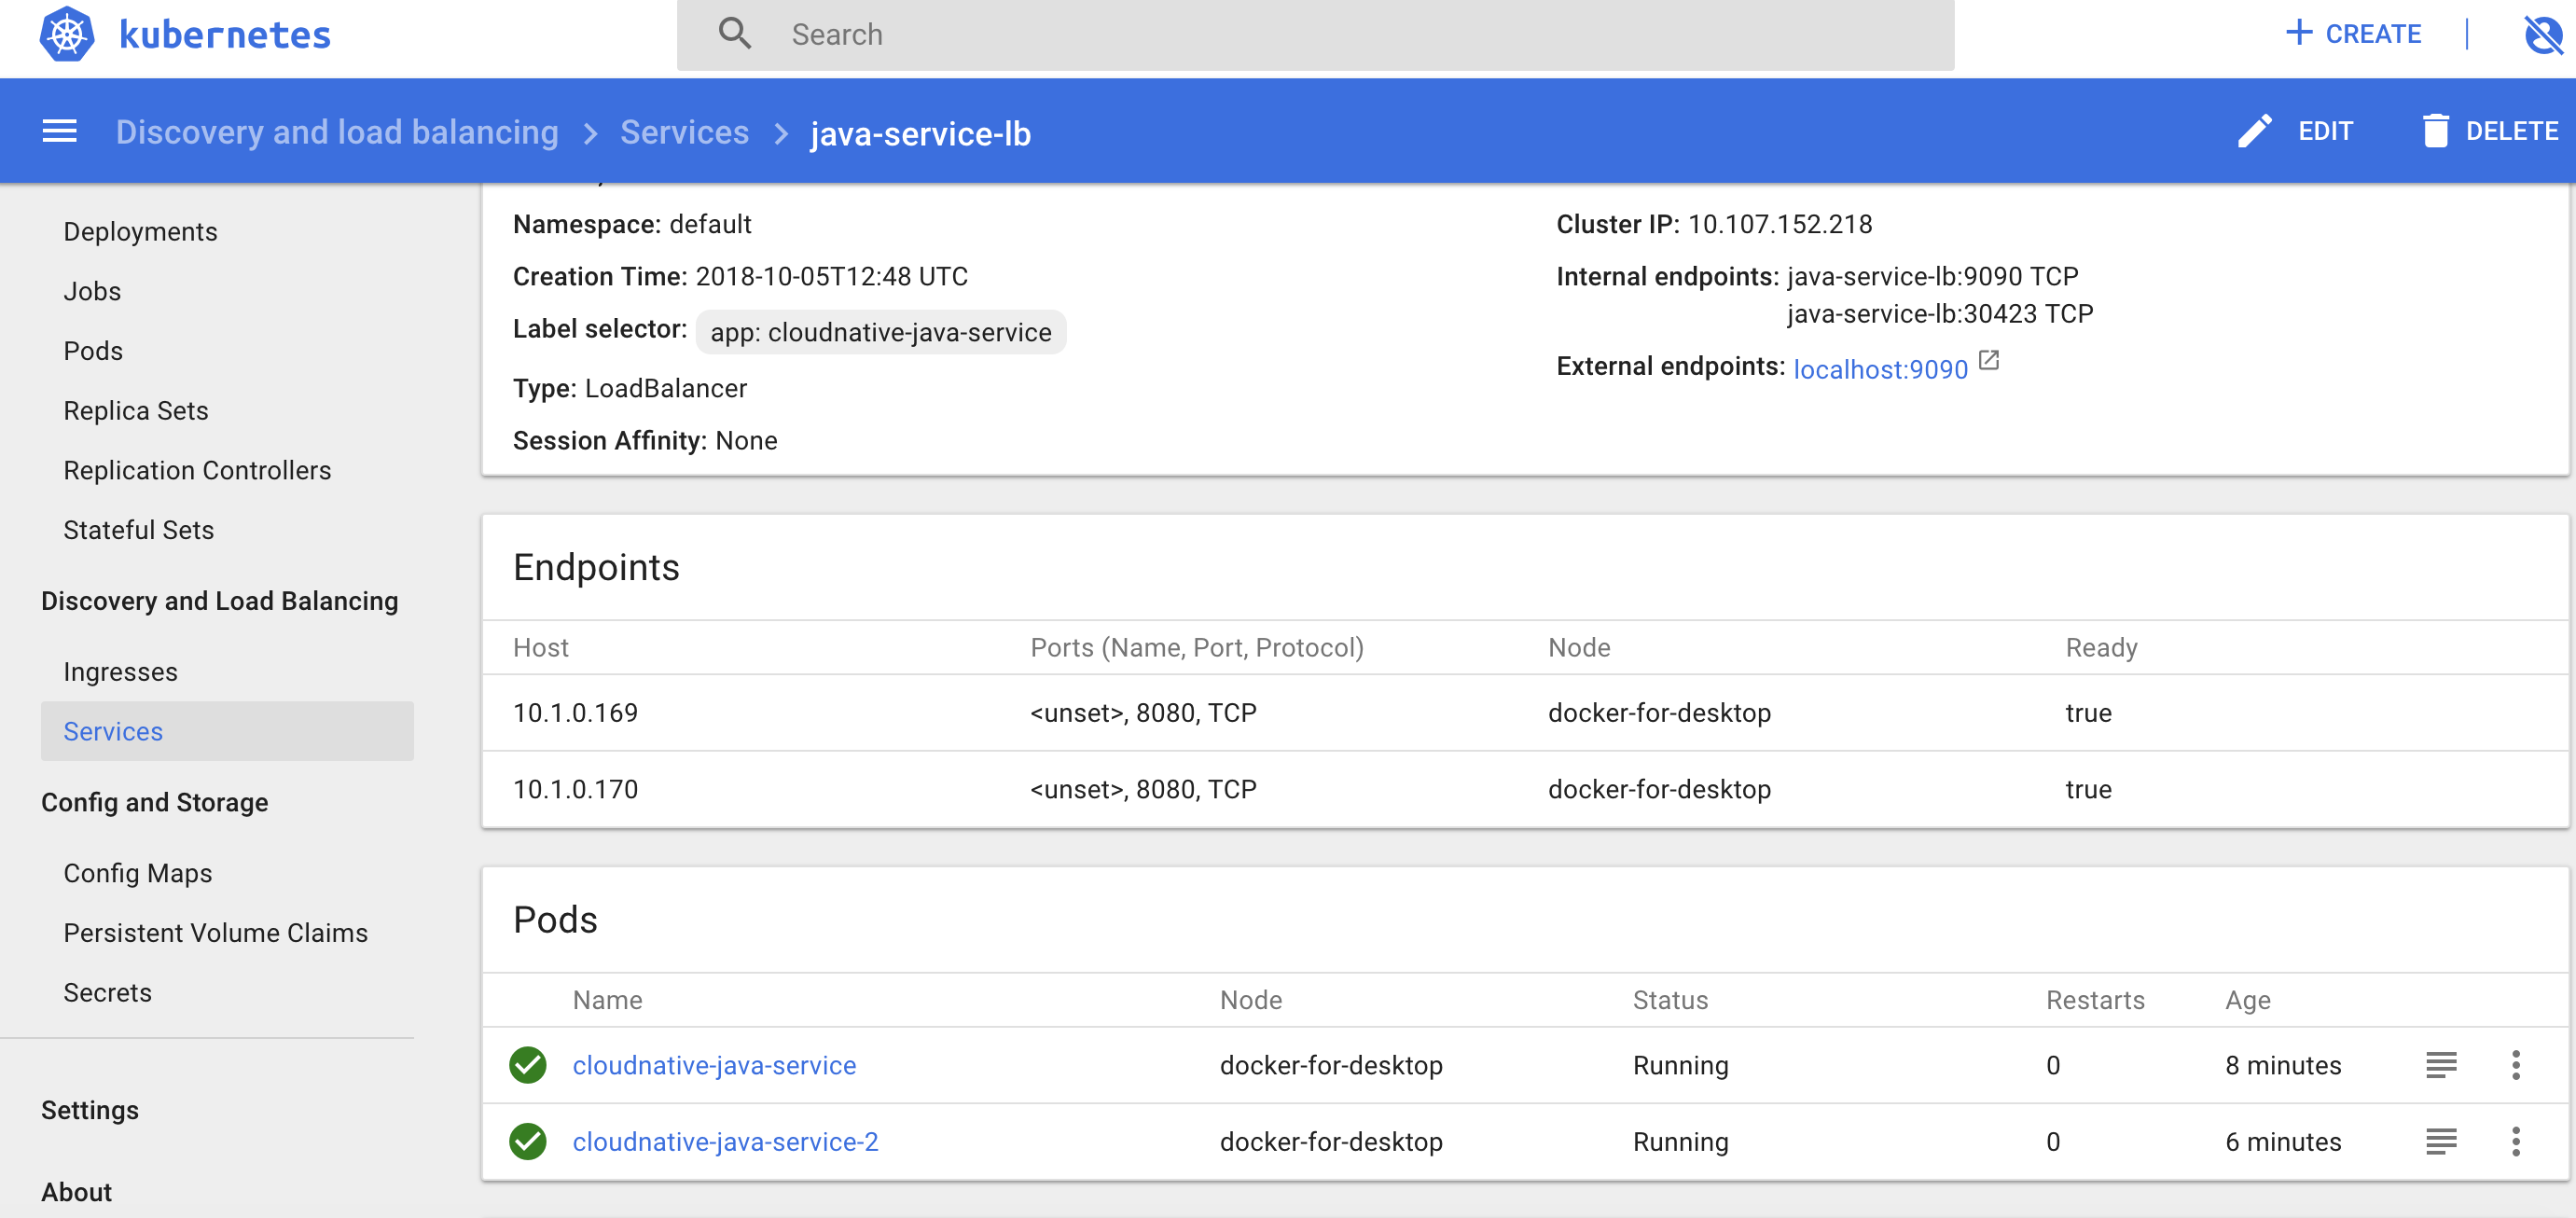
Yo can also get this from the terminal using :
1
kubectl describe svc java-service-lb
To confirm if our load balancer really works, we can create to pods of the java service, with one pod configured with One as instance.name and the other Two. By sending request to the LoadBalancer we can confirm if the request is routed to pods.
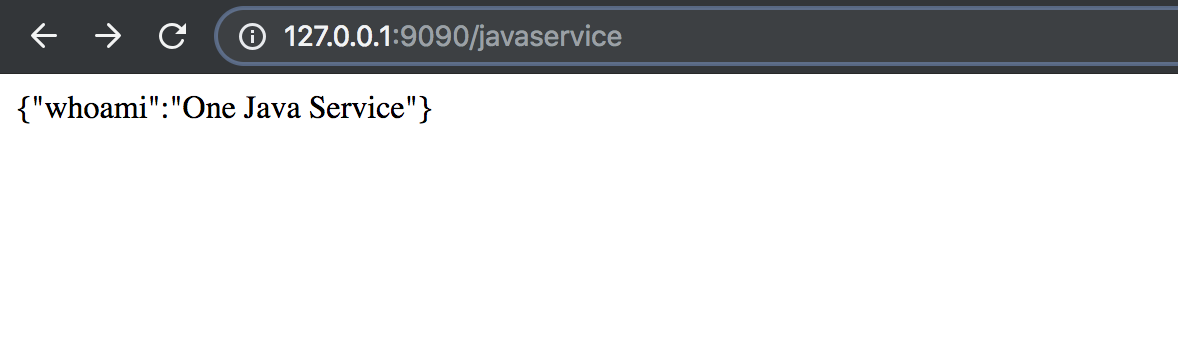
instance one
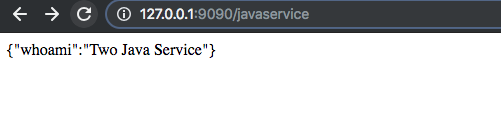
instance two
As you can see you our LoadBalancer has successfully routed request to both pod instances. To be frank I had to refresh the page like a million times before seeing the second image.
Creating Pods and connecting them with Services is all cool and all but there are certain things that are lacking. For example, the pod instances can go down and will require manual effort to bring them up.
When we delete all the pods, probably to update them, our load balancer will return an empty response because the pods are not governed by a deployment config. Imagine this pod is responsible for accepting payments on a highly active application.
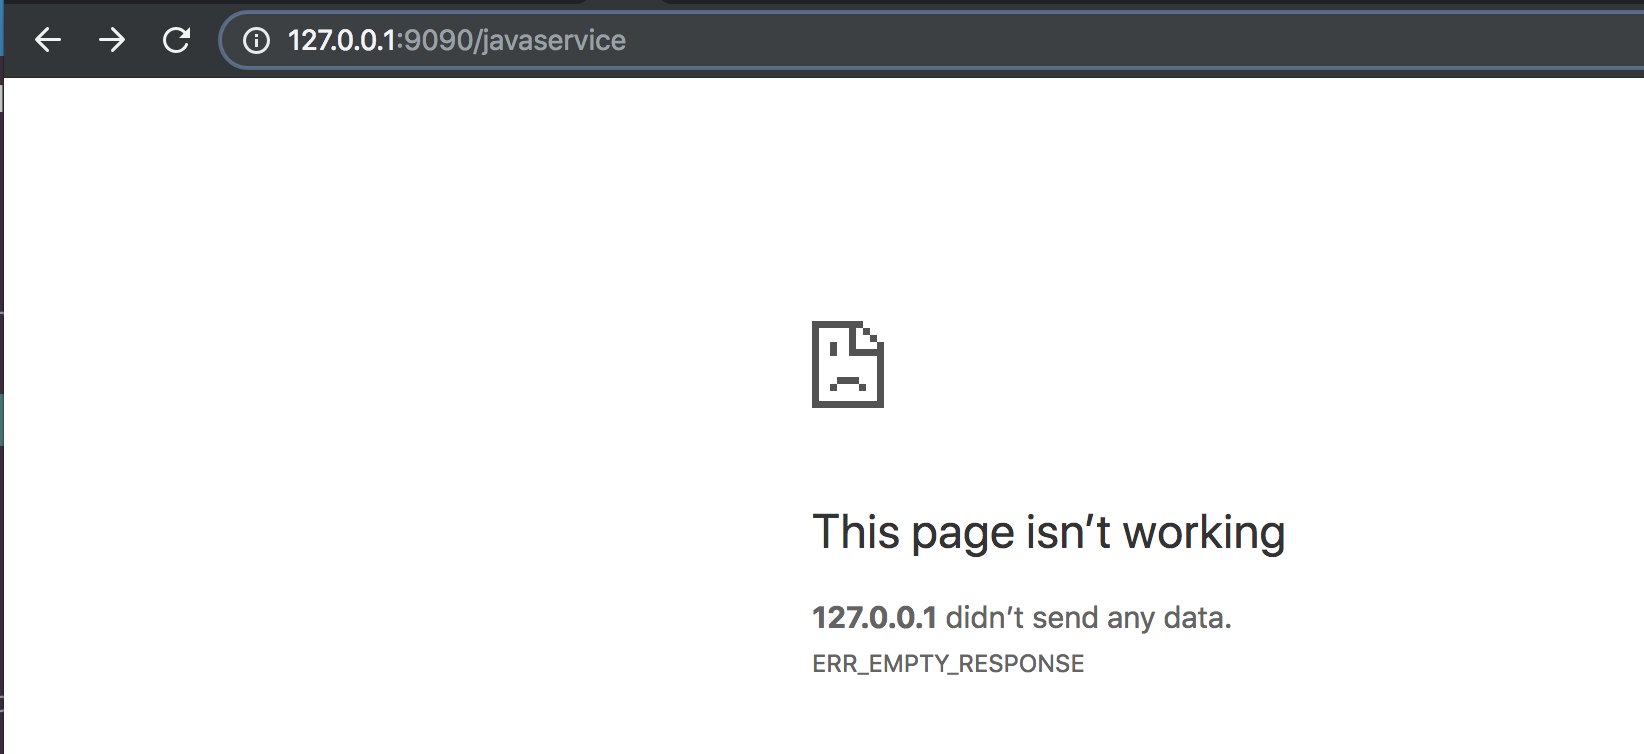
The next section highlights some of the awesome ways we can deploy, monitor, update and easily rollback deployments using the deployment configuration with benefits the cluster will lack if we created pods and services instead of deployments.
5. Ramped Deployment
As described in Deployment Section, Ramped Deployment ensures new versions one after the other by creating secondary replica sets of new pods and removing the old pods till the exact configuration is met. Below is a sample configuration we are using in sample project.
1
2
3
4
5
6
7
8
9
10
11
12
13
14
15
16
17
18
19
20
21
22
23
24
25
26
27
28
29
30
31
32
33
34
35
36
37
38
39
40
41
42
43
44
45
46
47
48
apiVersion: extensions/v1beta1
kind: Deployment
metadata:
  name: cloudnative-java-service-ramped
spec:
  replicas: 2
  minReadySeconds: 5
  strategy:
    type: RollingUpdate
    rollingUpdate:
      maxUnavailable: 1
      maxSurge: 1
  template:
    metadata:
      labels:
        app: cloudnative-java-service
    spec:
      containers:
      - image: stmalike/java-service
        imagePullPolicy: Always
        name: cloudnative-java-service
        ports:
         - containerPort: 8080
        livenessProbe:
          httpGet:
            path: /health
            port: http
          initialDelaySeconds: 40
          timeoutSeconds: 1
          periodSeconds: 15
        readinessProbe:
          httpGet:
            path: /health
            port: http
          initialDelaySeconds: 40
          timeoutSeconds: 1
          periodSeconds: 15
        volumeMounts:
          - name: cloudnative-config
            mountPath: "/config"
            readOnly: true
      volumes:
      - name: cloudnative-config
        configMap:
          name: cloudnative-config
          items:
          - key: application.properties
            path: application.properties
kind : Type of resource, Deployment
spec.replicas : Number of instances of the pod
spec.strategy.type : Type of Deployment Strategy. Note RollingUpdate is also known Ramped
spec.strategy.rollingUpdate : Ramped deployment configuration which specifies the maximum number of pods that need to unavailable at a time and number of pods to be added per deployment(maxSurge)
template: Template to create new pods with label configuration
1
kubectl apply -f java-service/java-service-ramped-deployment.yaml
We can see the status on the dashboard
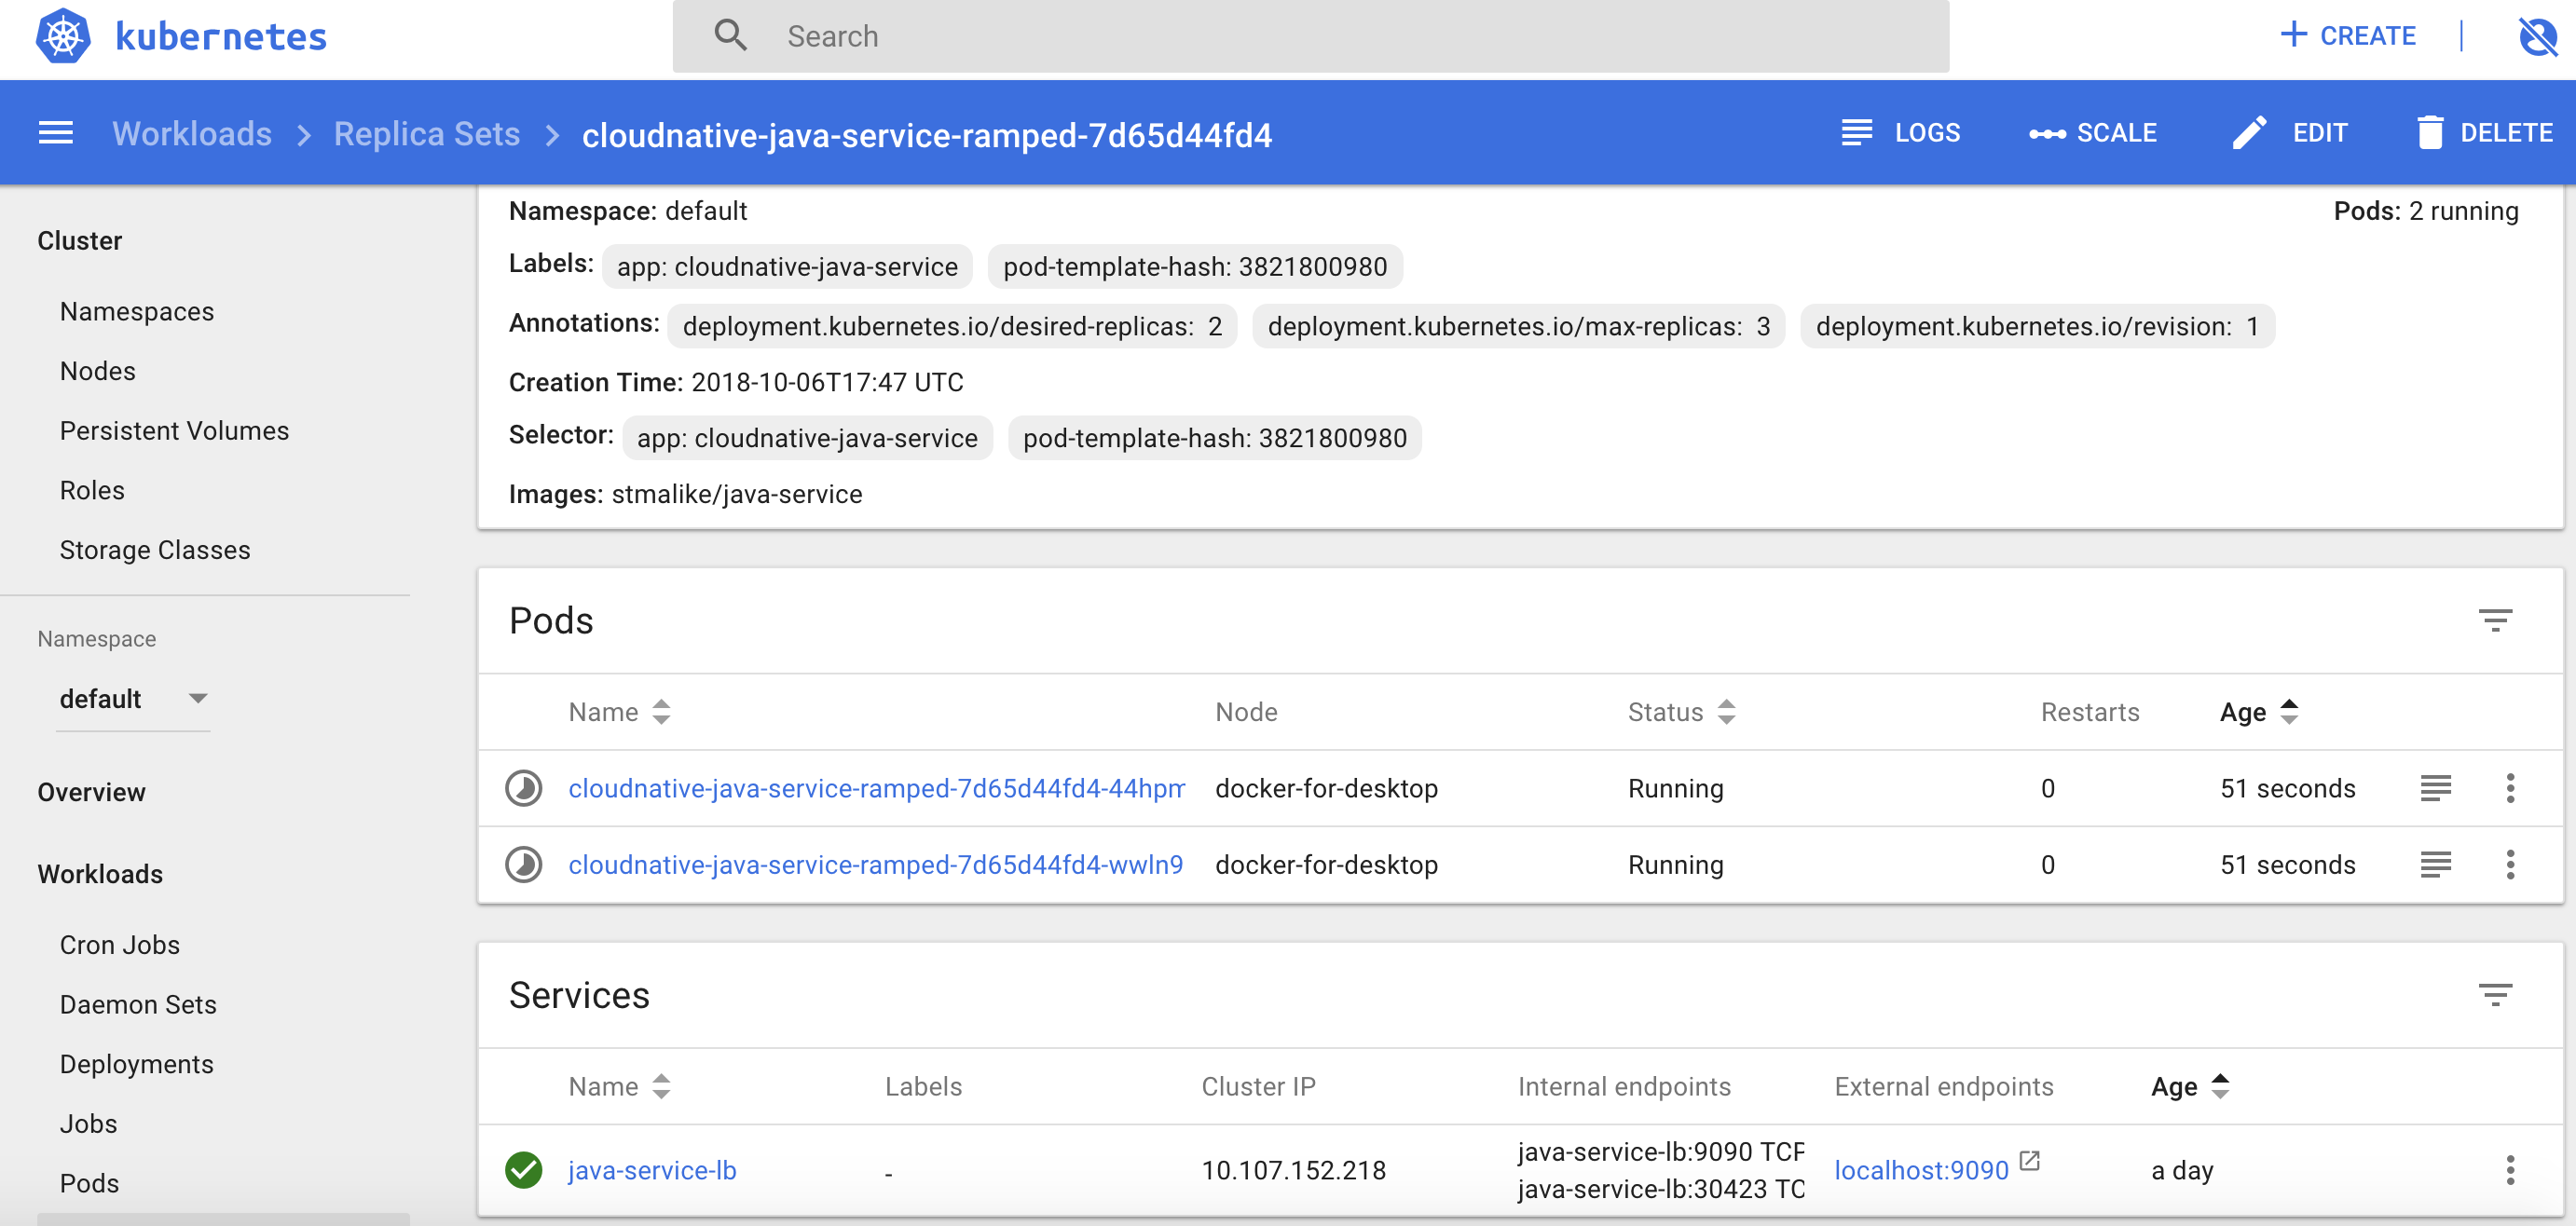
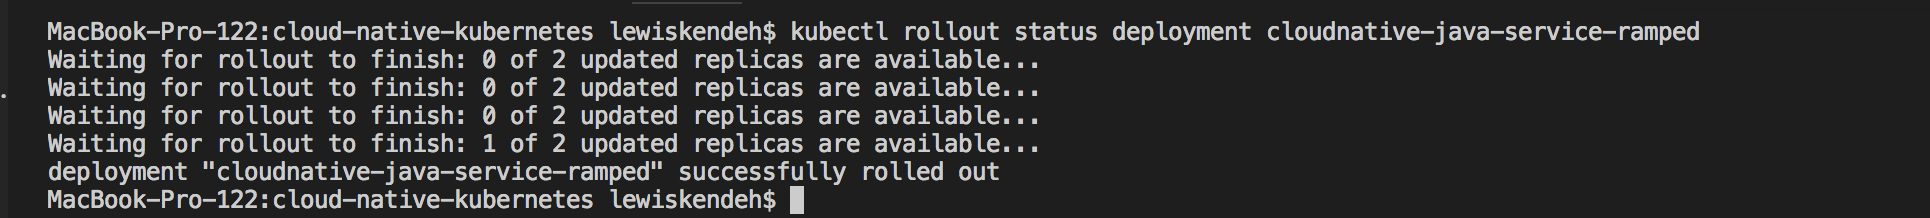
Or kubectl with command :
1
kubectl rollout status deployment cloudnative-java-service-ramped
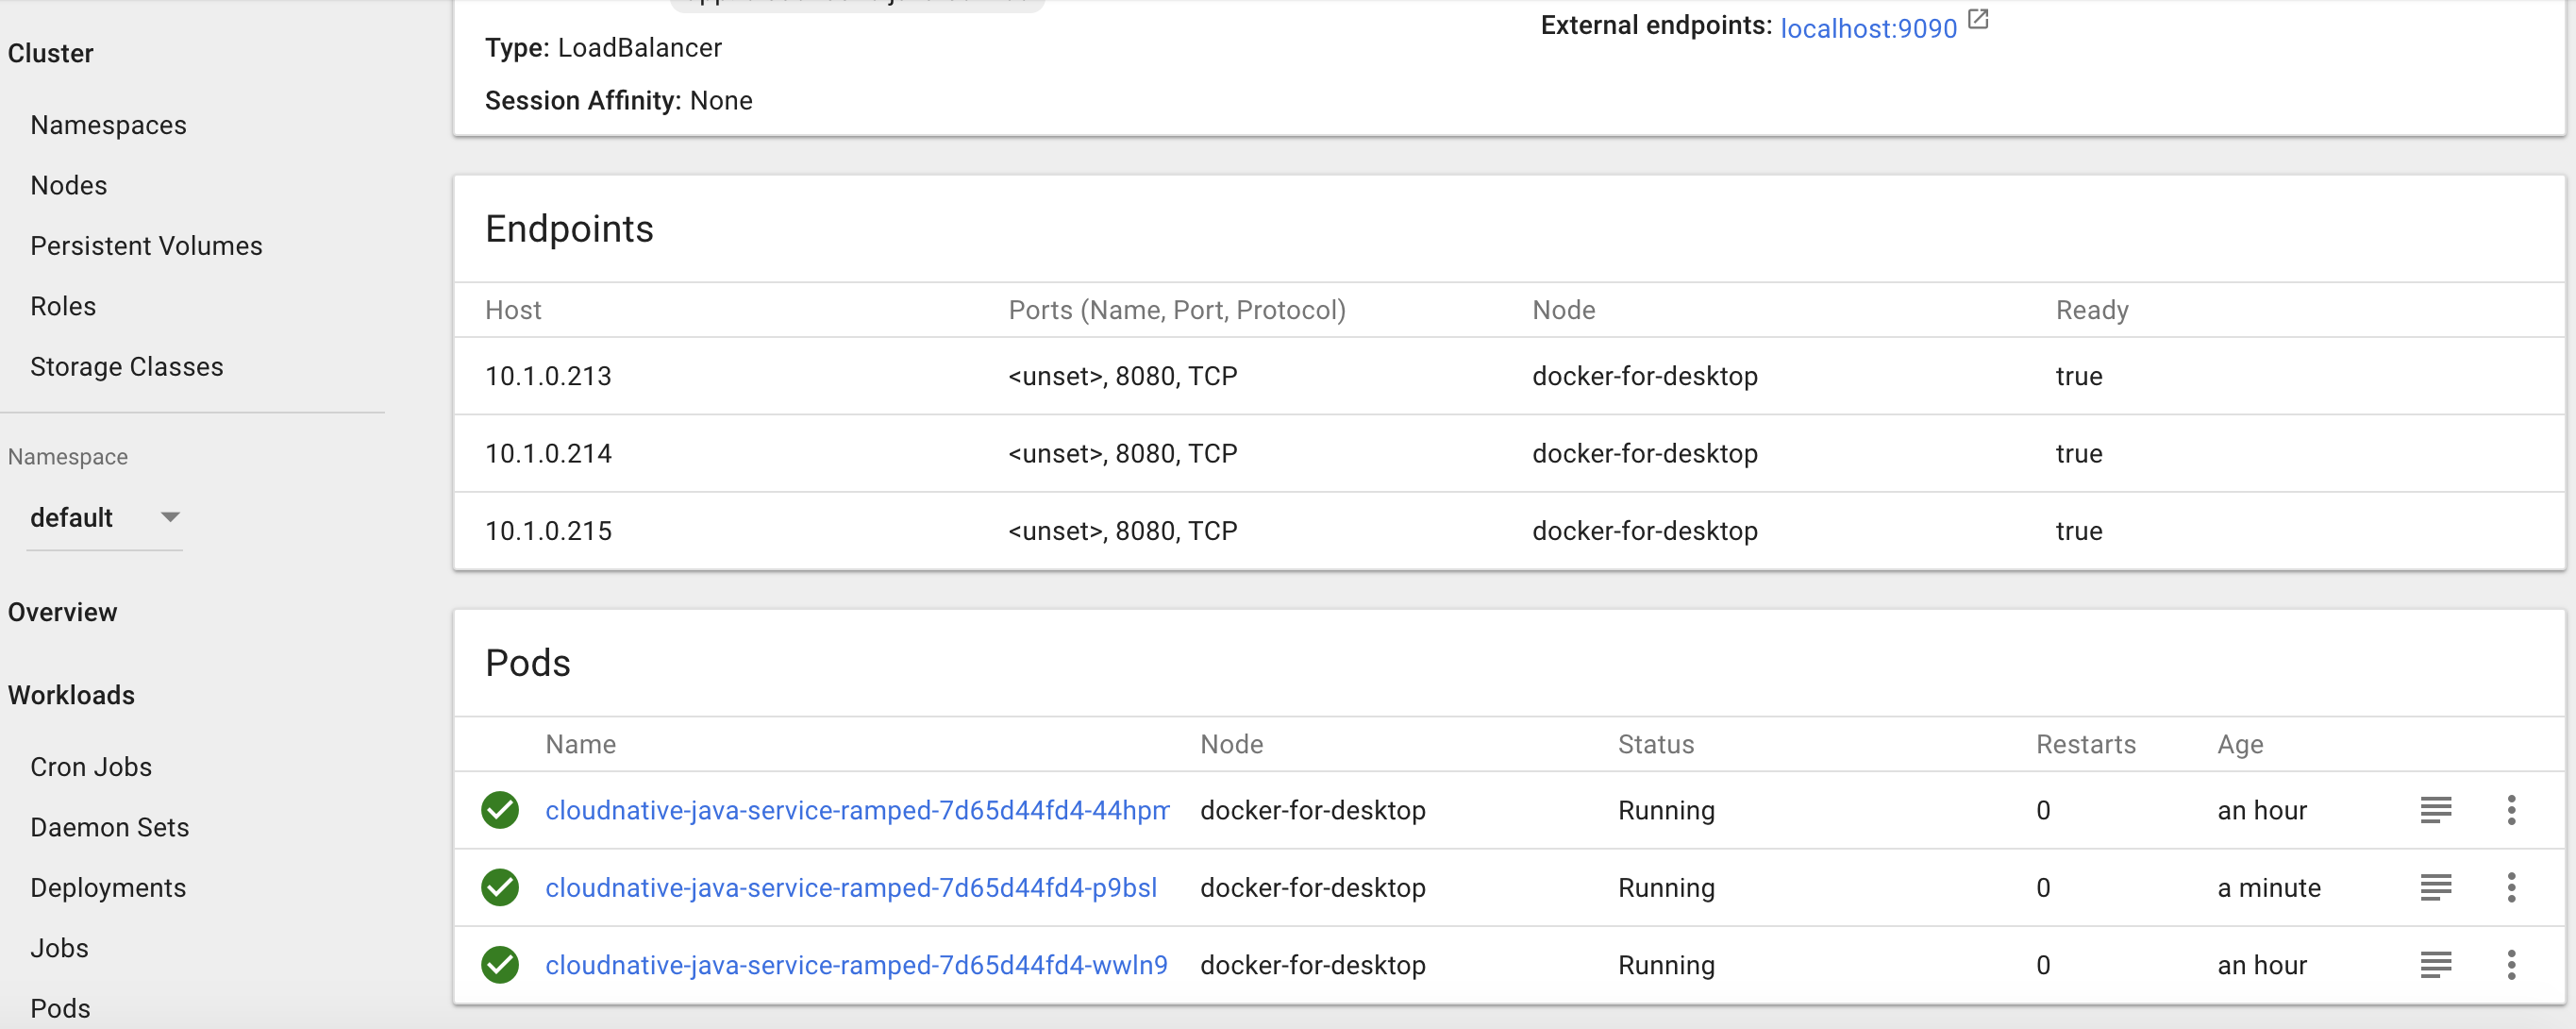
To verify, you can access the service http://127.0.0.1:9090/javaservice and check details of the deployment from the dashboard or kubectl with :
1
kubectl describe deployments cloudnative-java-service-ramped
Scaling Ramped Deployment
Kubernetes supports automatic vertical scaling of pods but for the purpose of making this article short, it will be dealt in another post.
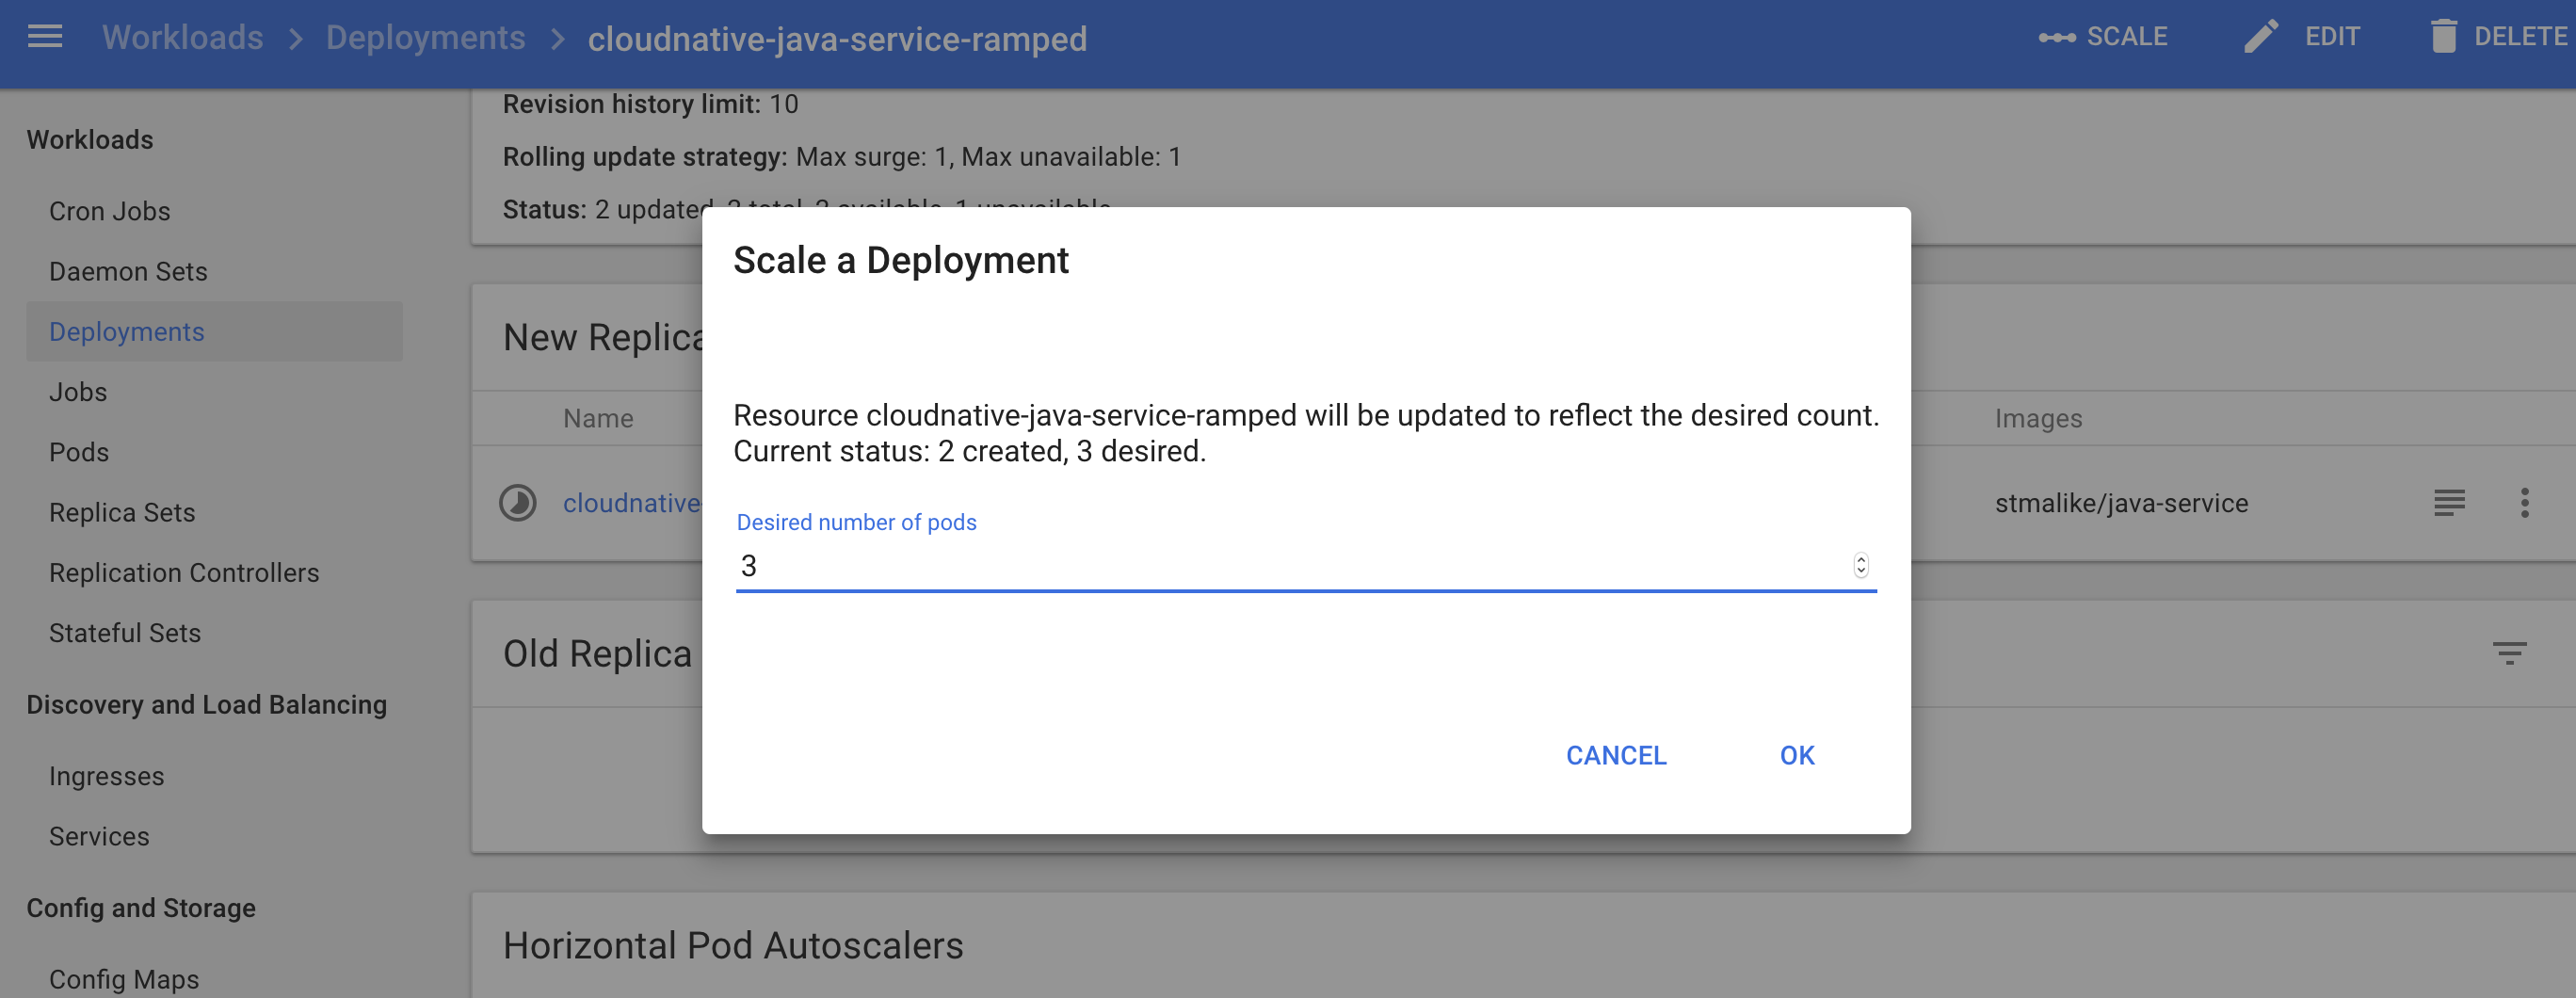
For manual vertical scaling, you can easily do it from the dashboard or the deployment configuration.
i. Update replica size to 3
ii. New pod started
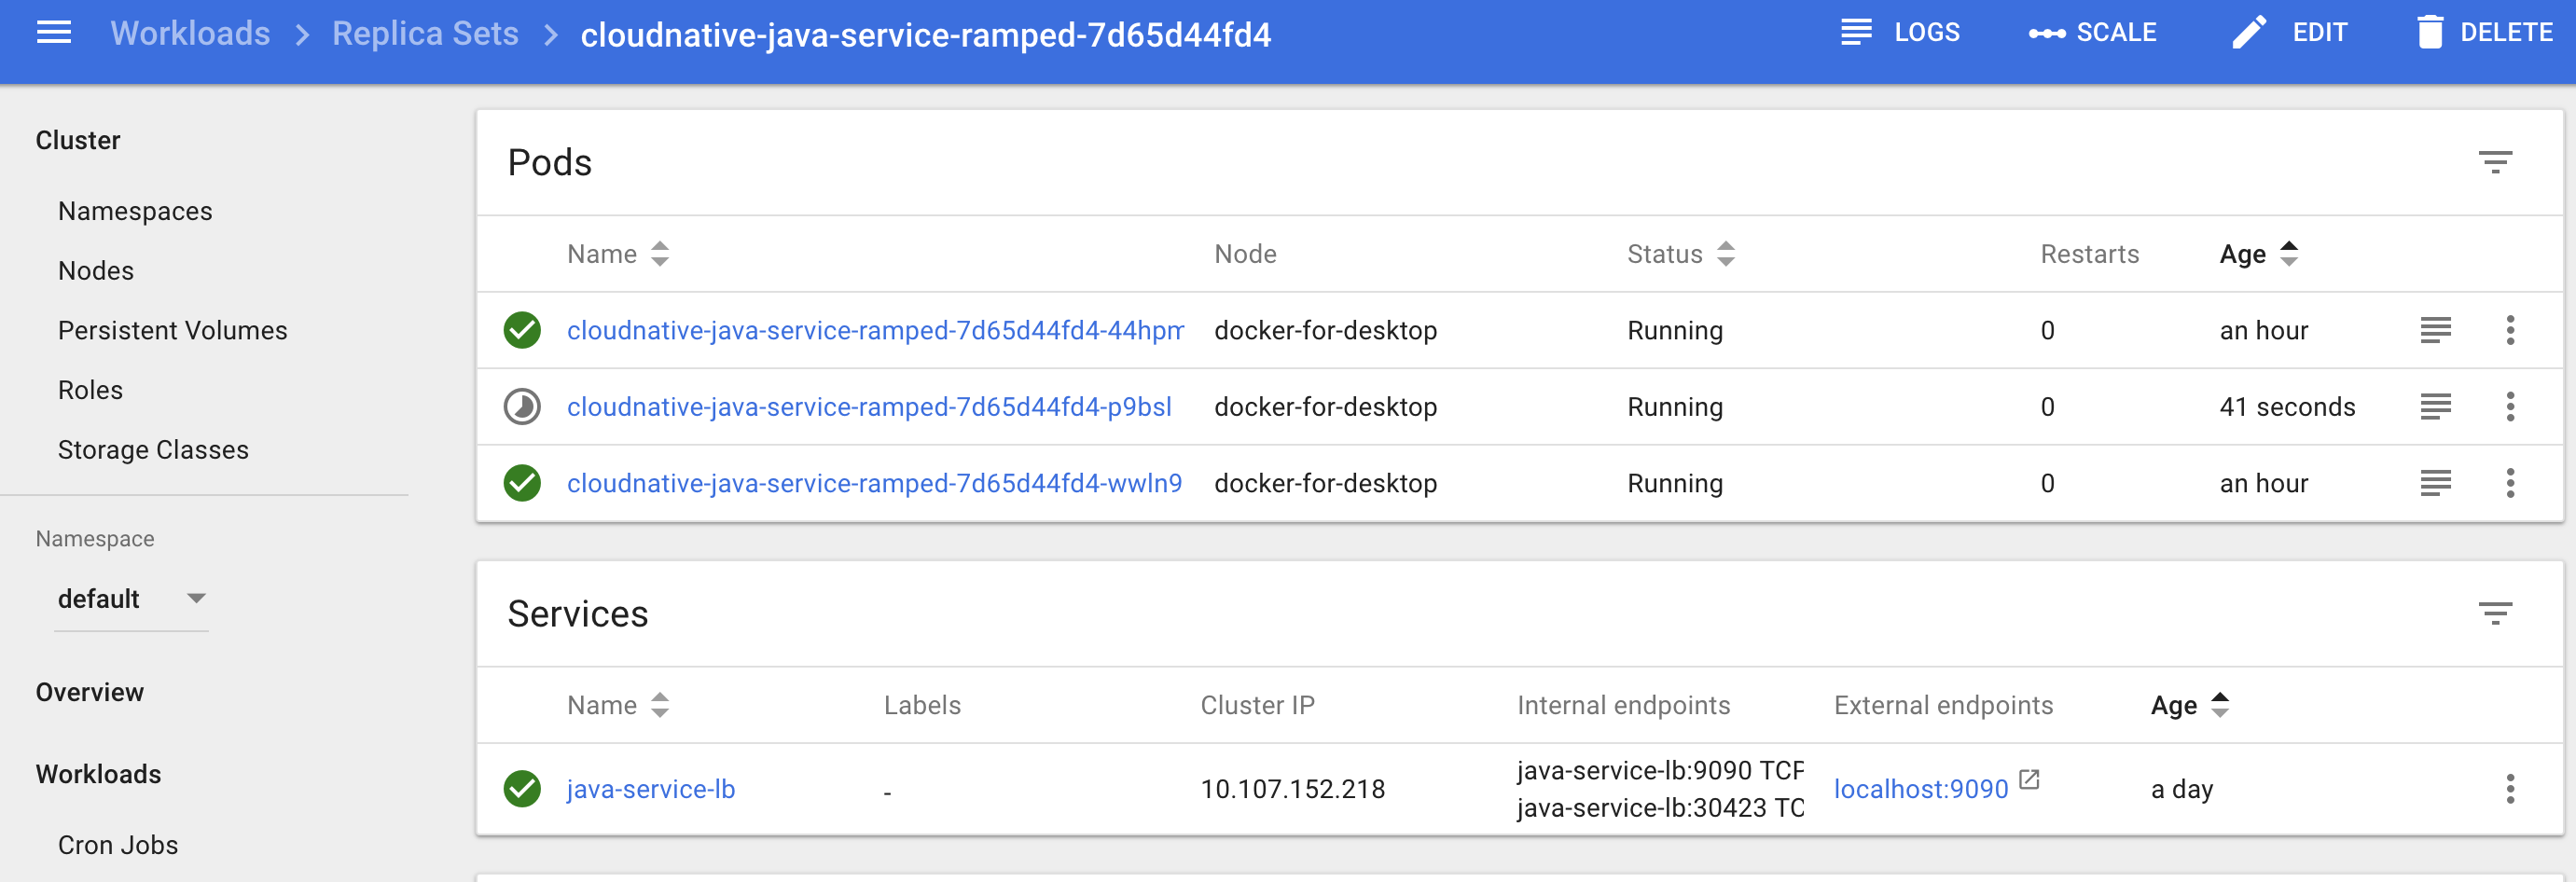
iii. New pod running
or by just changing this part of our deployment configuration and run this command:
1
2
spec:
  replicas: 3
1
 kubectl apply -f java-service/java-service-ramped-deployment.yaml --record

One thing you’ll notice after increasing the replicas to 3 is although we had only 2 pods initially by increasing the replicas to 3 Kubernetes notices that our pods running do not match and automatically starts 1 extra pod. That’s all it takes. For a manual process this is pretty simple so you can imagine how the automatic vertical scaling will work.
No Downtime Update of Pods in Ramped Deployment
To show how this will work, I created a docekr image of the java-service with a slight update to the json retunred and taged it as UPDATE2_0.
This is the update we want to deploy, we start by changing the config to point to the new image
1
2
3
4
5
spec:
      containers:
      - image: stmalike/java-service:UPDATE2_0
        imagePullPolicy: Always
        name: cloudnative-java-service
and then execute
1
 kubectl apply -f java-service/java-service-ramped-deployment.yaml --record
You can continously refresh the link http://127.0.0.1:9090/javaservice, you’ll notice that the content changed without any downtime with the load balancer.
The stages of how the updates happened can be visualized on the dashboard as follows
i. Brings down one pod ,because “maxUnavailable” is 1 in deployment config
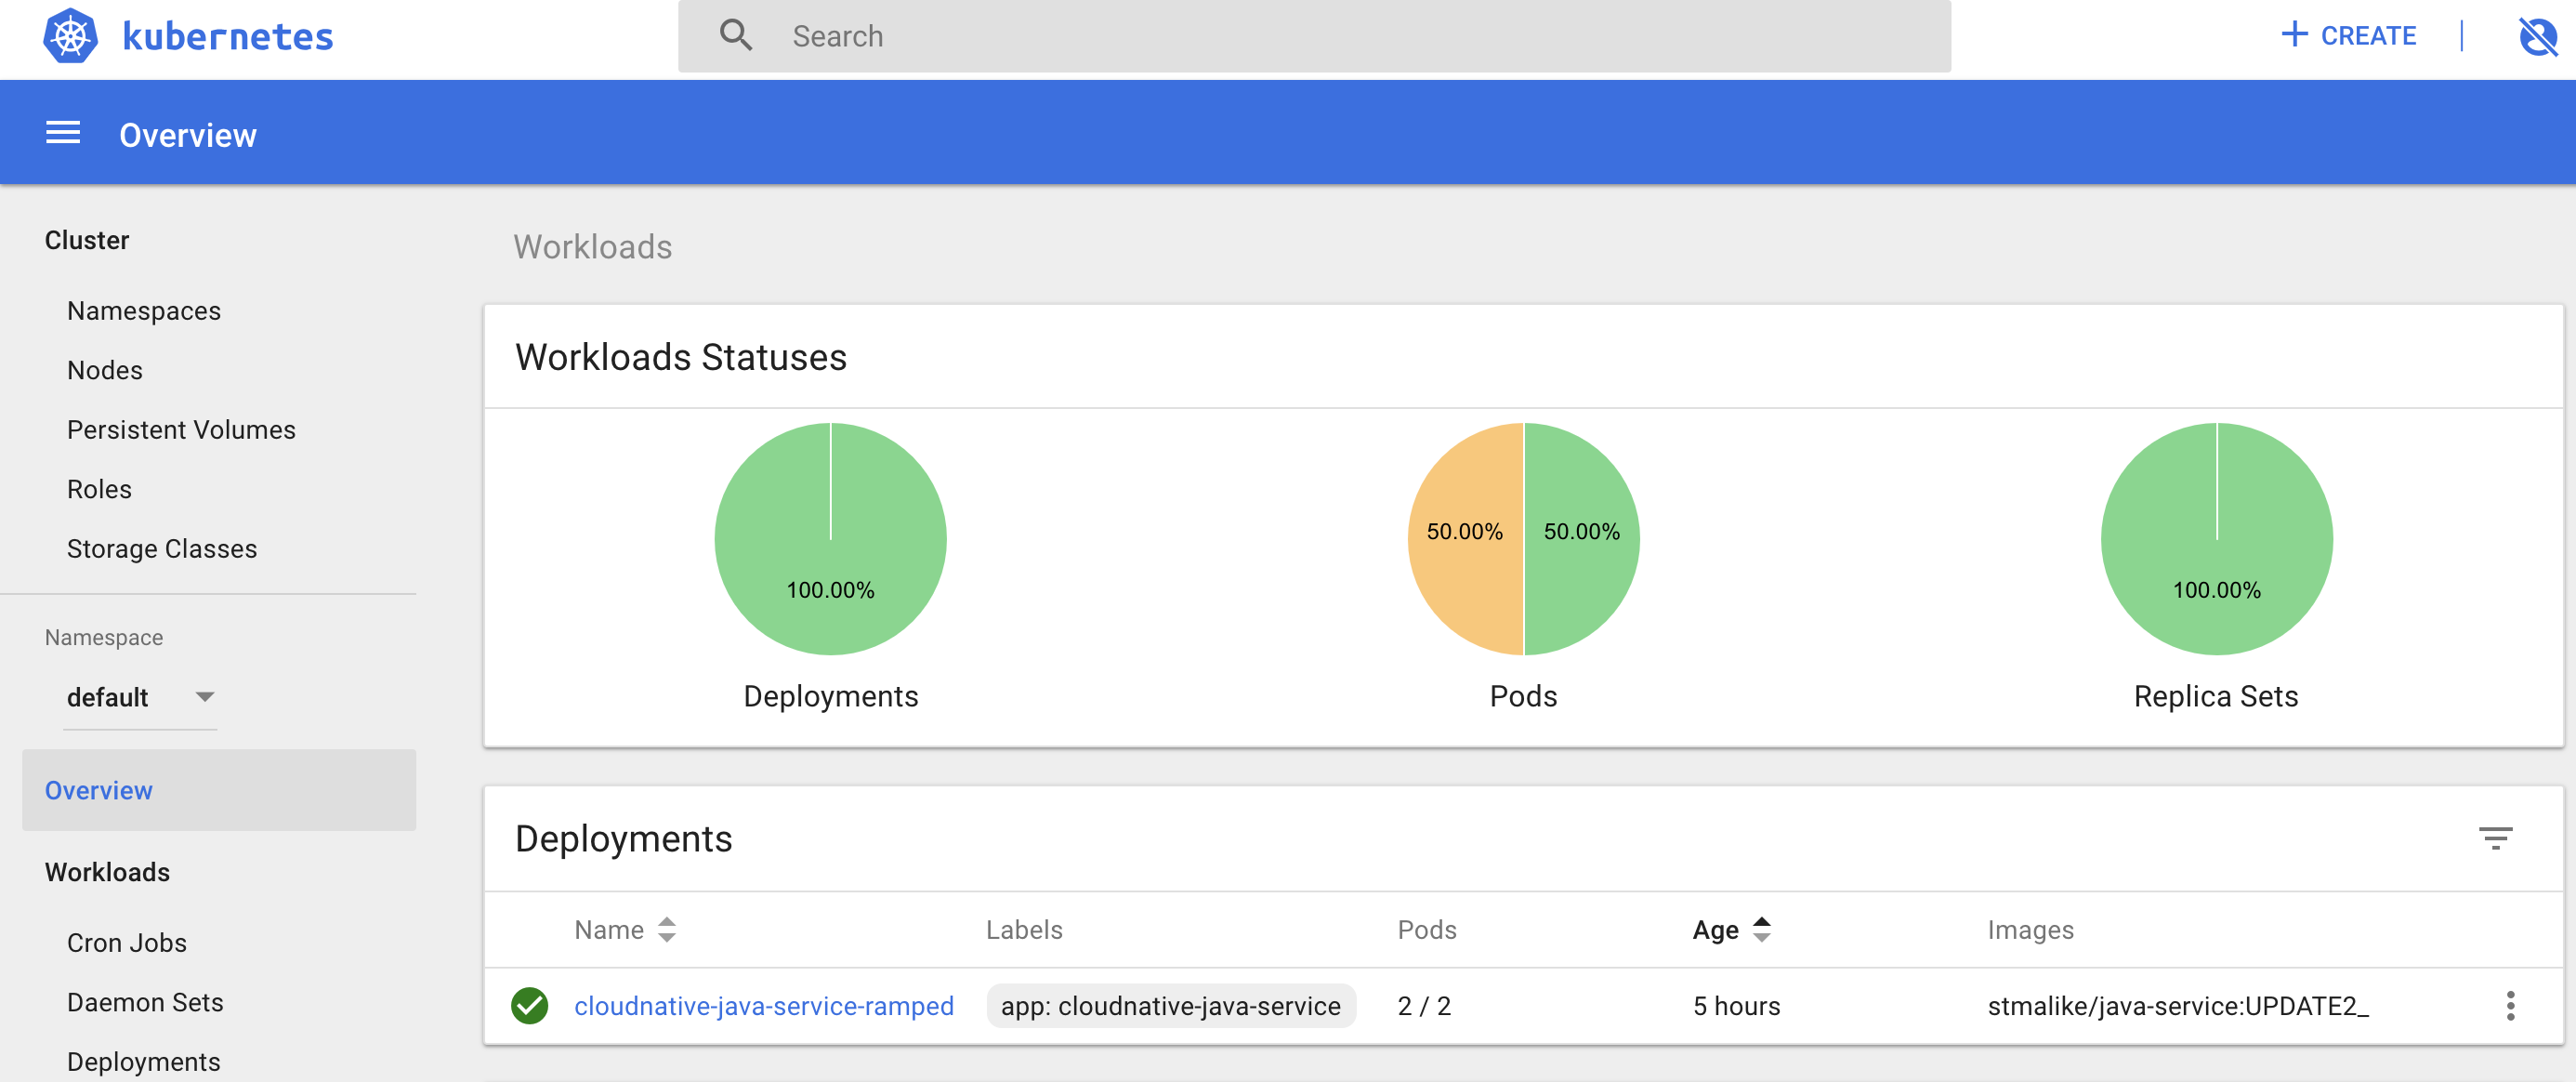
ii. Adds new updated pod as secondary ,because “maxSurge” is 1 in deployment config
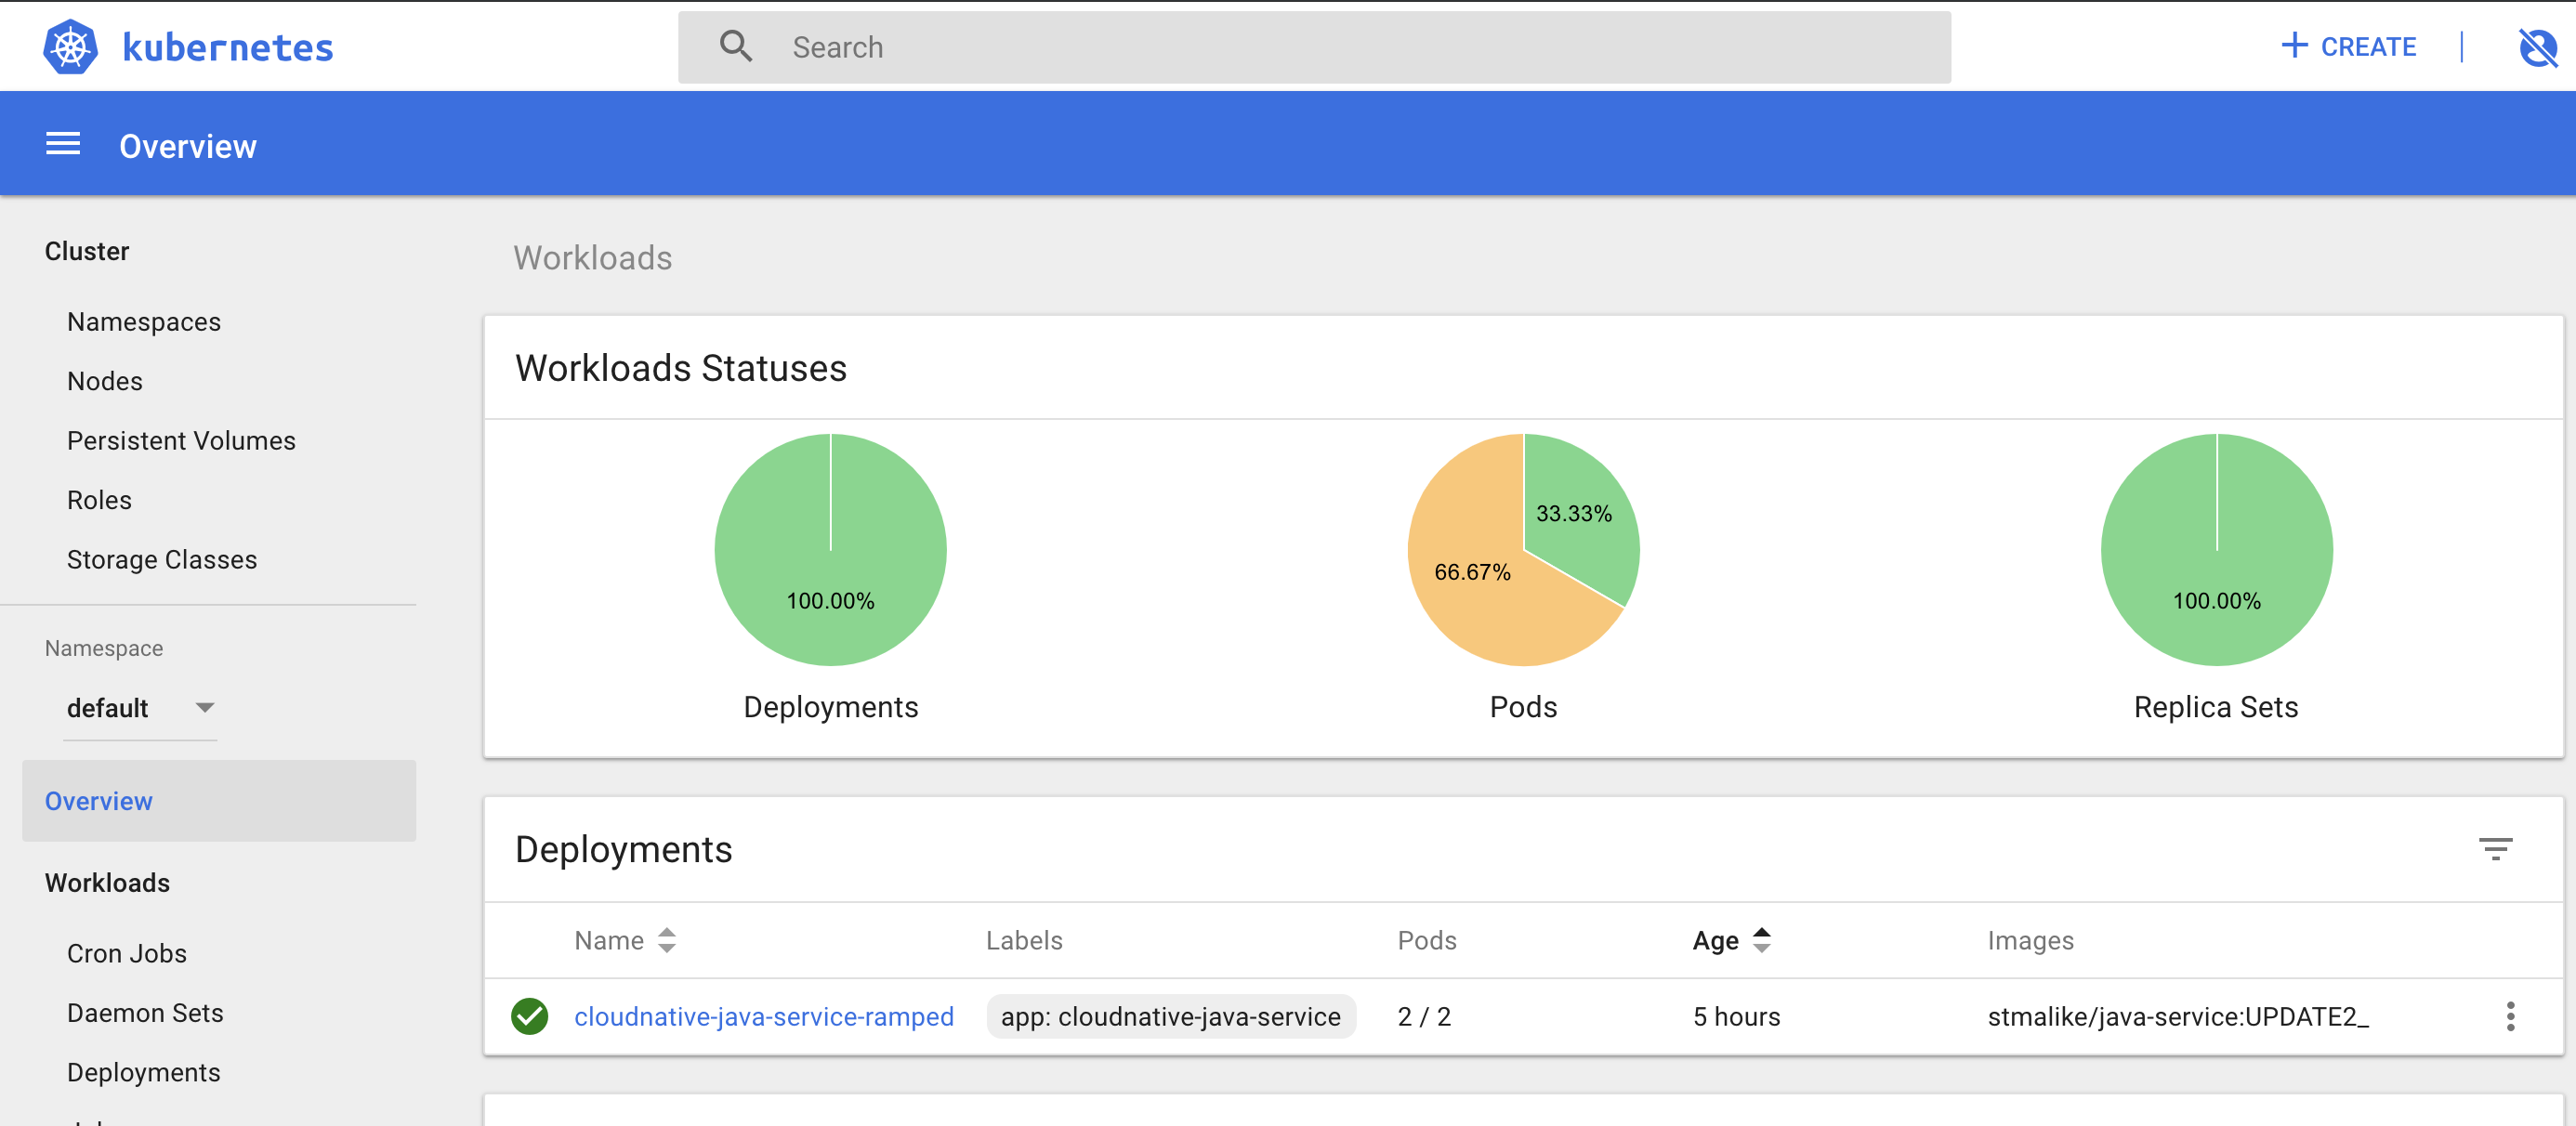
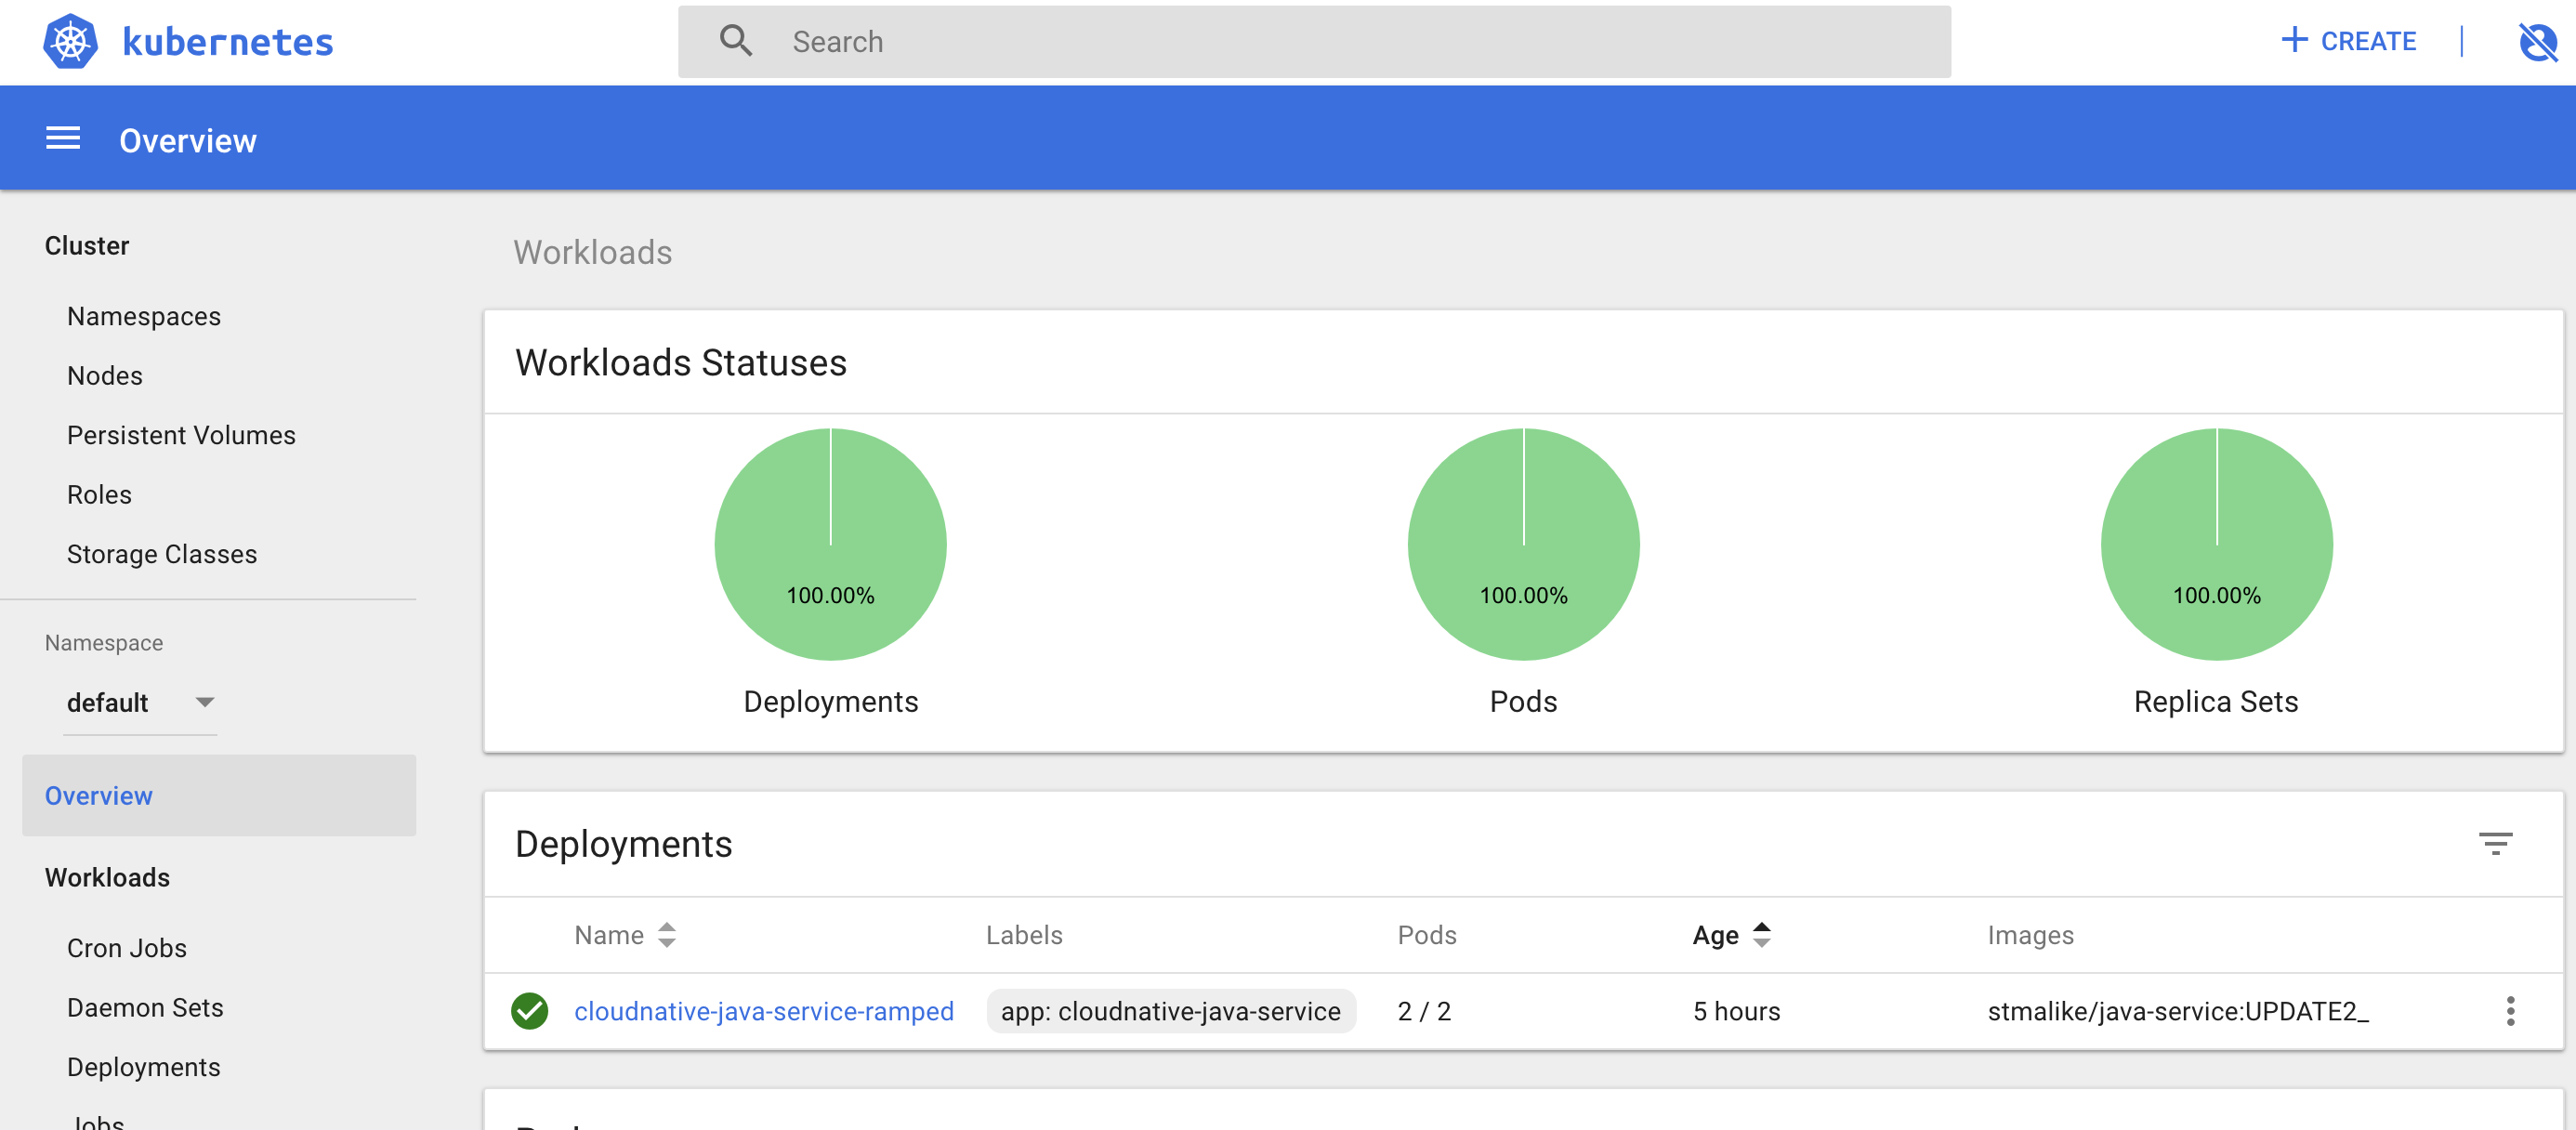
iii. Removed old versions and voila we have our cluster
and as usual this can also be monitored on the terminal using :
1
kubectl rollout status deployment cloudnative-java-service-ramped
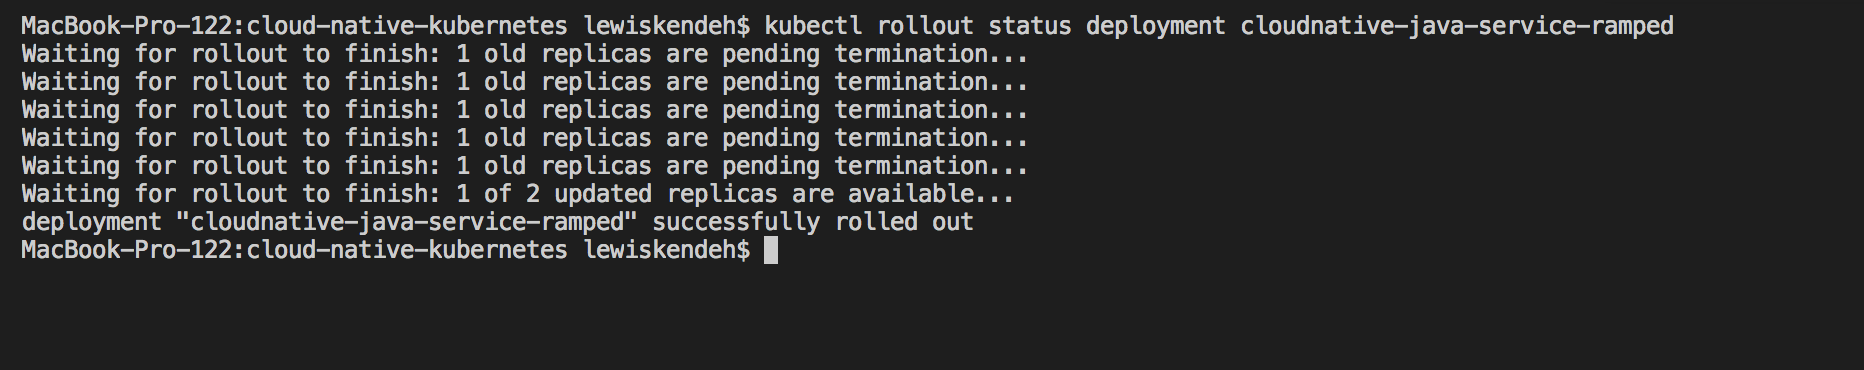
During the whole process if you pinged the load balancer, you’ll continue getting a response till it finally updates. NO DOWN TIME.
RollingBack Updates in Ramped Deployment
As if updates are not cool enough, rolling back updates is even simpler, Our new container has a bug, the json returned by the service, http://127.0.0.1:9090/javaservice , can’t be parse.
first get your deployment history
1
kubectl rollout history deployment cloudnative-java-service-ramped
and then just revert to the previous revision number which is 1 in this case.
1
kubectl rollout undo deployment cloudnative-java-service-ramped --to-revision=1
…and again, the roll back is done with no downtime.
So we understand how the Ramped deployment works. Now we can look at another type of deployment.
6. Canary Deployment with Istio
The Ramped is cool and all till we need to deploy a specific service for our customer in a particular region or using a particular channel ,for example iOS mobile. This is where the Canary deployment is useful.
I also wanted to use Istio in this example to show how awesome Service Meshes are and what vital roles they can play in our cluster.
Install Istio and after enable automatic sidecar injection for our default namespace. This just means every pod deployed in the default namespace will have will have Istio Sidecar.
1
kubectl label namespace default istio-injection=enabled
or manually
1
kube-inject -f java-service/java-service-canary-istio-deployment.yaml | kubectl apply -f -
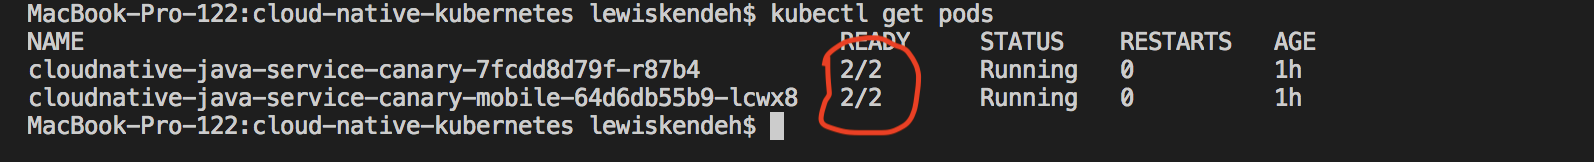
When we check the pods with bash kubectl get pods it will confirm the Istio side-car proxy,Envoy, was also installed into our pod as well. The pods now show 2 items in each pod.
Istio deployment configuration which will route all request with header channel as mobile to instance 2 of our java microservice but everything else will go to instance 1.
There 2 deployment files for the java-service with different tags, latest and UPDATE2_0. UPDATE2_0 will handle all mobile requests and the other for web request.
So this is the initial deployment and service configuration for the application
1
2
3
4
5
6
7
8
9
10
11
12
13
14
15
16
17
18
19
20
21
22
23
24
25
26
27
28
29
30
31
32
33
34
35
36
37
38
39
40
41
42
43
44
apiVersion: apps/v1beta1
kind: Deployment
metadata:
  name: cloudnative-java-service-canary
  labels:
    app: cloudnative-java-service
spec:
  replicas: 1
  template:
    metadata:
      labels:
        app: cloudnative-java-service
        version: cloudnative-java-service
    spec:
      containers:
      - image: stmalike/java-service
        imagePullPolicy: IfNotPresent
        name: cloudnative-java-service
        ports:
         - containerPort: 8080
        volumeMounts:
          - name: cloudnative-config
            mountPath: "/config"
            readOnly: true
      volumes:
      - name: cloudnative-config
        configMap:
          name: cloudnative-config
          items:
          - key: application.properties
            path: application.properties
---
apiVersion: v1
kind: Service
metadata:
  name: java-service-lb
spec:
  type: LoadBalancer
  ports:
  - port: 9090
    protocol: TCP
    targetPort: 8080
  selector:
    app: cloudnative-java-service
This has to be updated to version UPDATE2_0 but just for users on mobile first. Based on the performance we can enable it for our users on web.
Being able control the routing in Istio will require 3 configuration a Gateway, VirtualService and DestinationRule.
1
2
3
4
5
6
7
8
9
10
11
12
13
14
15
16
17
18
19
20
21
22
23
24
25
26
27
28
29
30
31
32
33
34
35
36
37
38
39
40
41
42
43
44
45
46
47
48
49
50
51
apiVersion: networking.istio.io/v1alpha3
kind: Gateway
metadata:
  name: java-service-istio-lb
spec:
  selector:
    istio: ingressgateway
  servers:
  - port:
      number: 9191
      name: http
      protocol: HTTP
    hosts:
    - "*"
---
apiVersion: networking.istio.io/v1alpha3
kind: VirtualService
metadata:
  name: java-service-istio-vs
spec:
  hosts:
  - "*"
  gateways:
  - java-service-istio-lb
  http:
  - match:
    - headers:
        channel:
          exact: mobile
    route:
    - destination:
        host: java-service-istio-rule
        subset: mobile-route
  - route:
    - destination:
        host: java-service-istio-rule
        subset: web-route
---
apiVersion: networking.istio.io/v1alpha3
kind: DestinationRule
metadata:
  name: java-service-istio-rule
spec:
  host: "*"
  subsets:
  - name: mobile-route
    labels:
      version: cloudnative-java-service-mobile
  - name: web-route
    labels:
      version: cloudnative-java-service
1
kubectl create -f java-service/java-service-canary-istio-deployment.yaml
Gateway acts as a load balancer which handling requests and their response.
VirtualService which is bound to a gateway to controls forwarding of the request that comes to the gateway.
DestinationRule defines the routing policies.
We have different types of routing policies in Istio and it’s not just restricted to headers present in request. This makes Istio smarter load balancer. It can forward request based on performance of the recieving pods, or configure fixed percentage of traffic distributed to multiple pods based on their specs, forward based on user or user location and other routing techniques. It makes Istio for me ..A MUST HAVE in any kubernetes cluster.
One other HUGE advantage of using Istio is the out-of-the-box added benefits. Which requires little configuration and no coding to use.
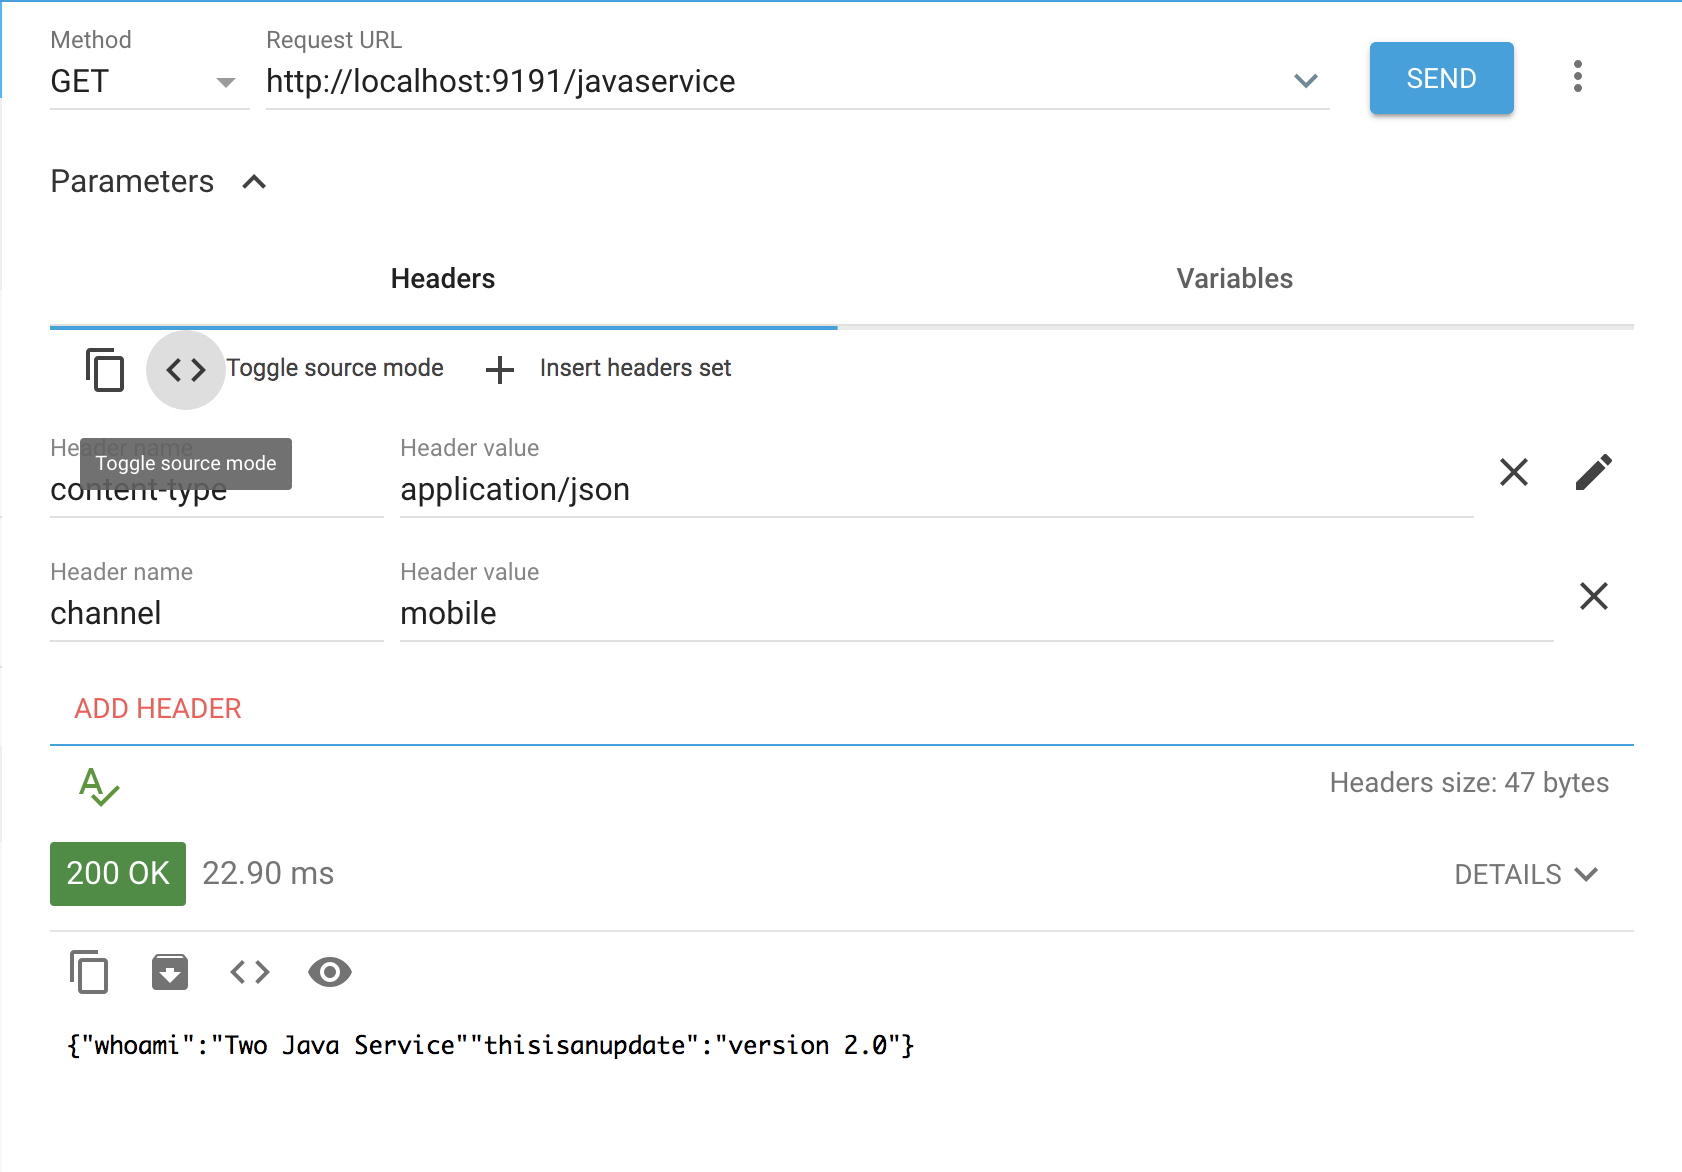
1. canary mobile route
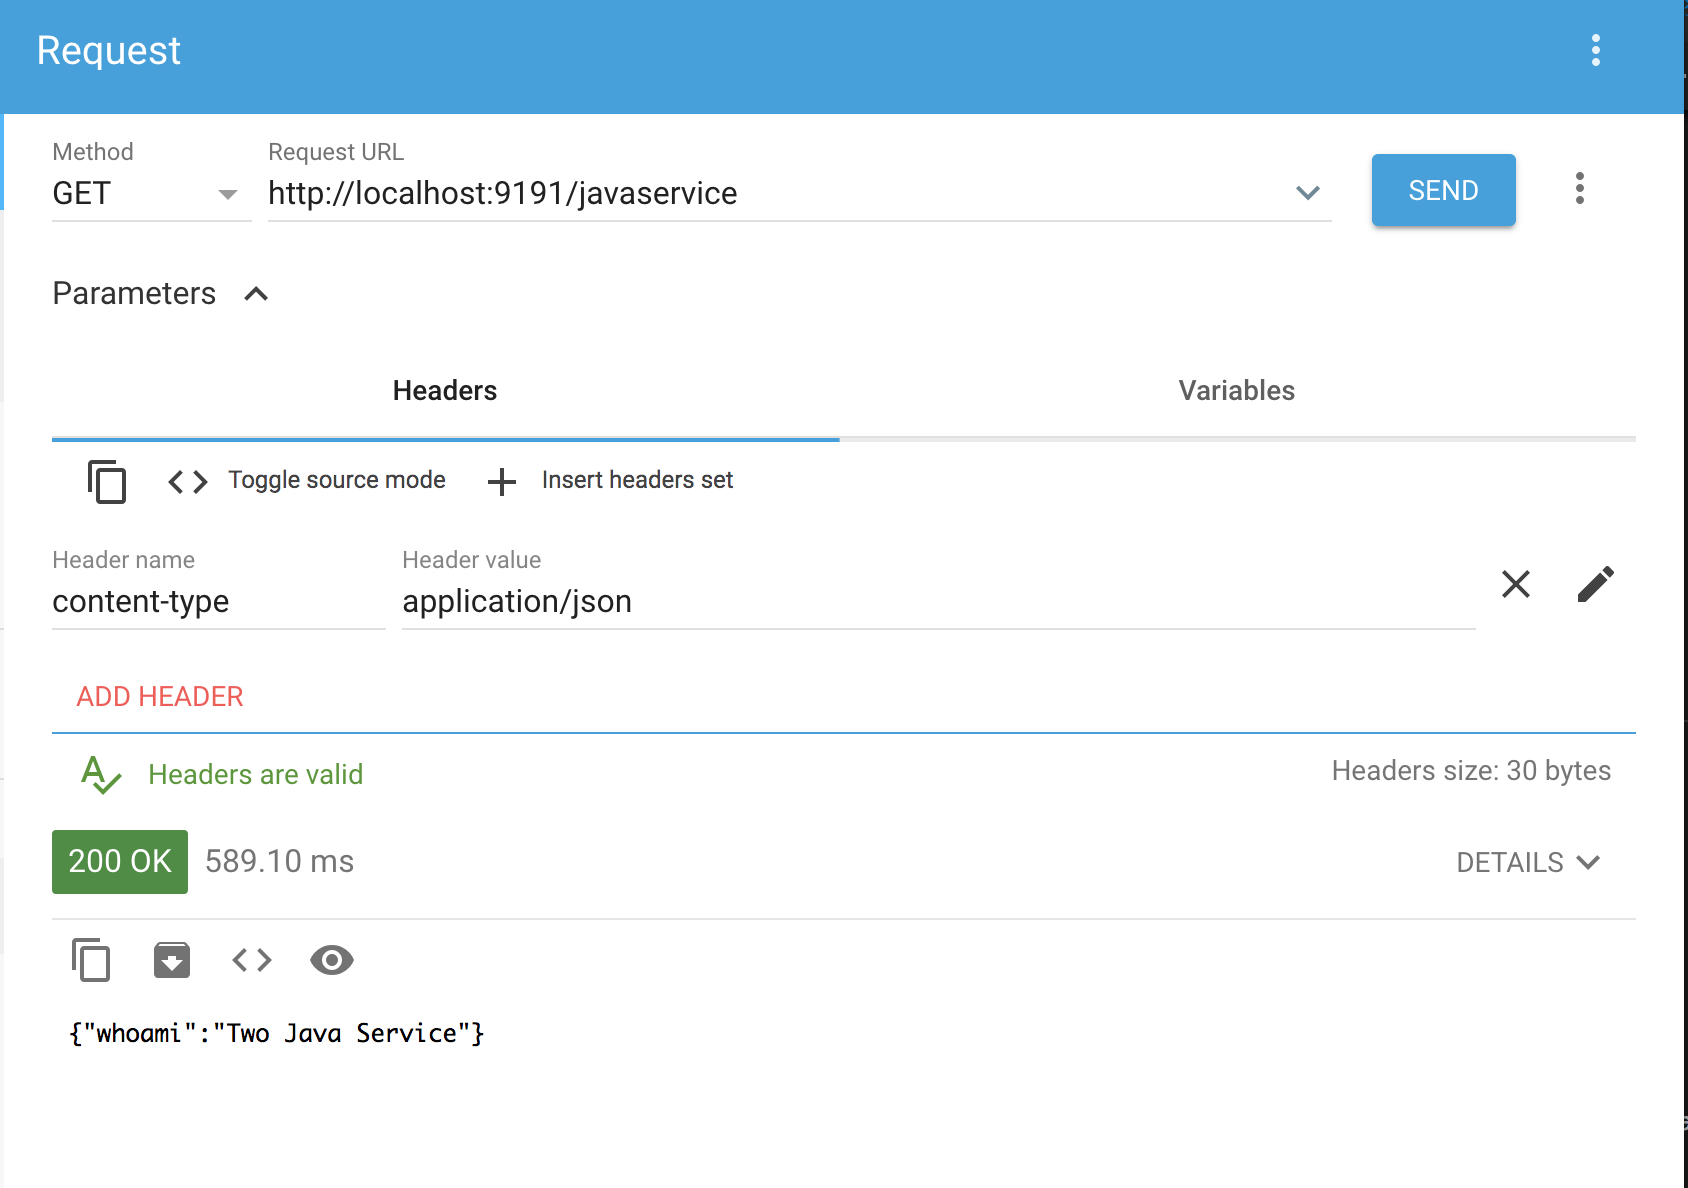
2. canary web route
Once everything is perfect for our mobile users we can easily upgrade the pod in the web deployment configuration java-service-canary-istio-deployment.yaml to complete Canary deployment using Istio
1
2
3
4
5
 spec:
      containers:
      - stmalike/java-service:UPDATE2_0
        imagePullPolicy: IfNotPresent
        name: cloudnative-java-service-canary
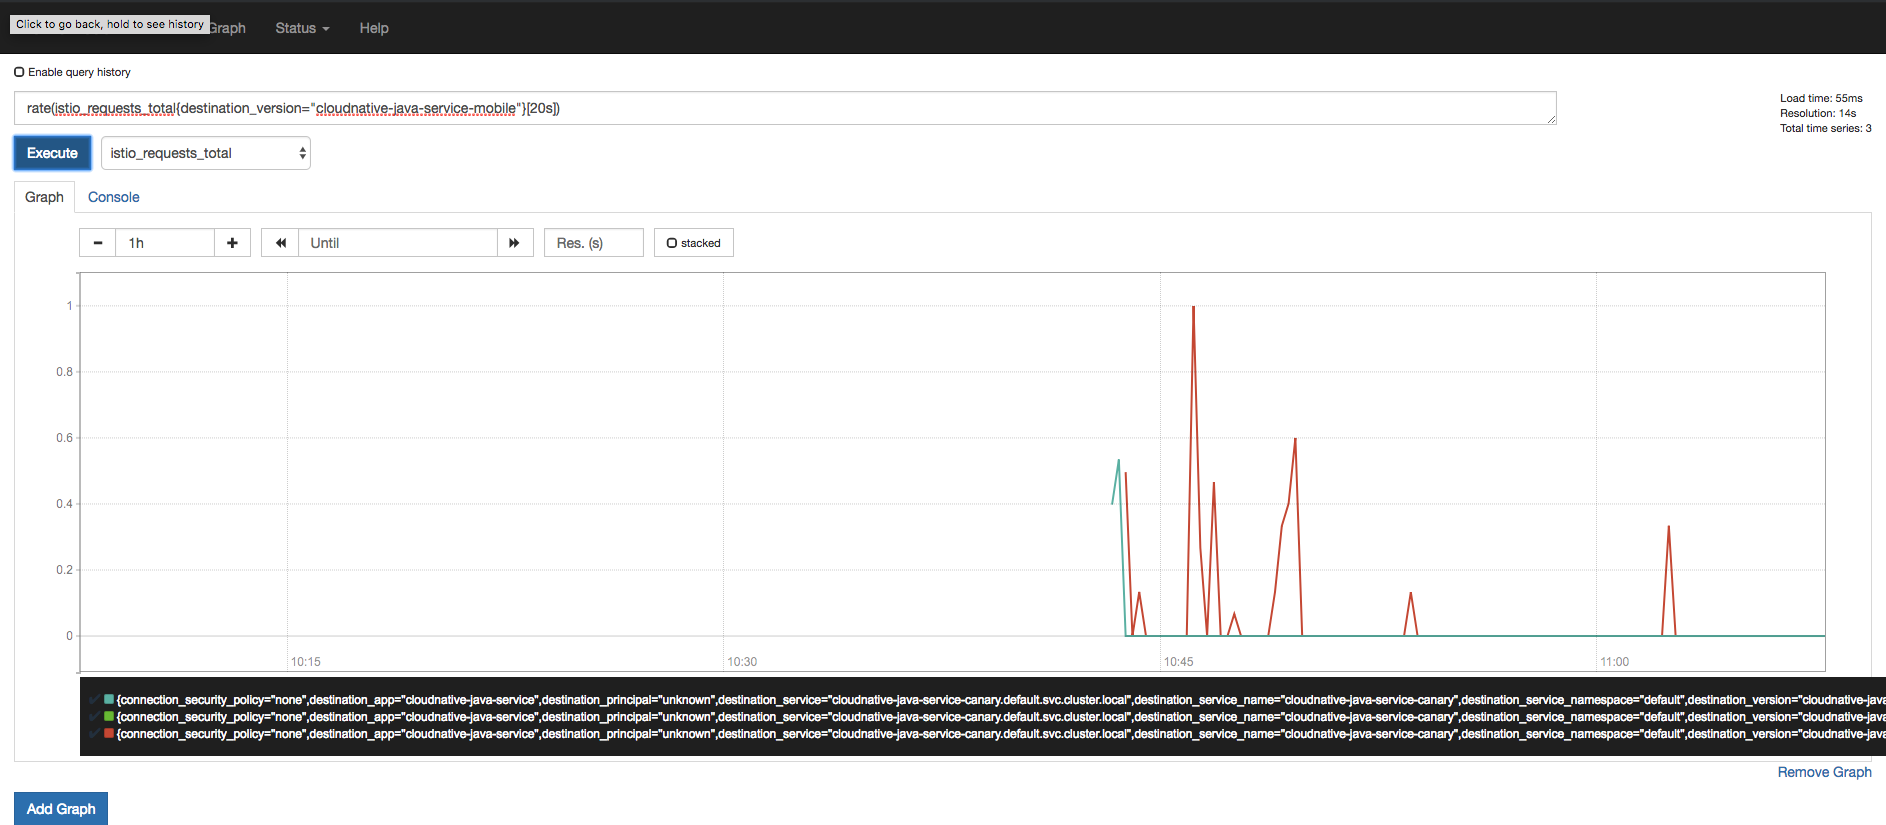
Collecting and Visualizing Metrics
Istio and Envoy proxy automatically collects metrics and this requires no development. These metrics are forwarded to Mixer which supports multiple adapters.
Based on these metrics we can create rich dashboards to understand and monitor performance of the cluster.
To visualize the metrics in Prometheus, we run
1
kubectl -n istio-system port-forward $(kubectl -n istio-system get pod -l app=prometheus -o jsonpath='{.items[0].metadata.name}') 9090:9090 &
By forwarding the port we can access the dashboard on http://localhost:9090
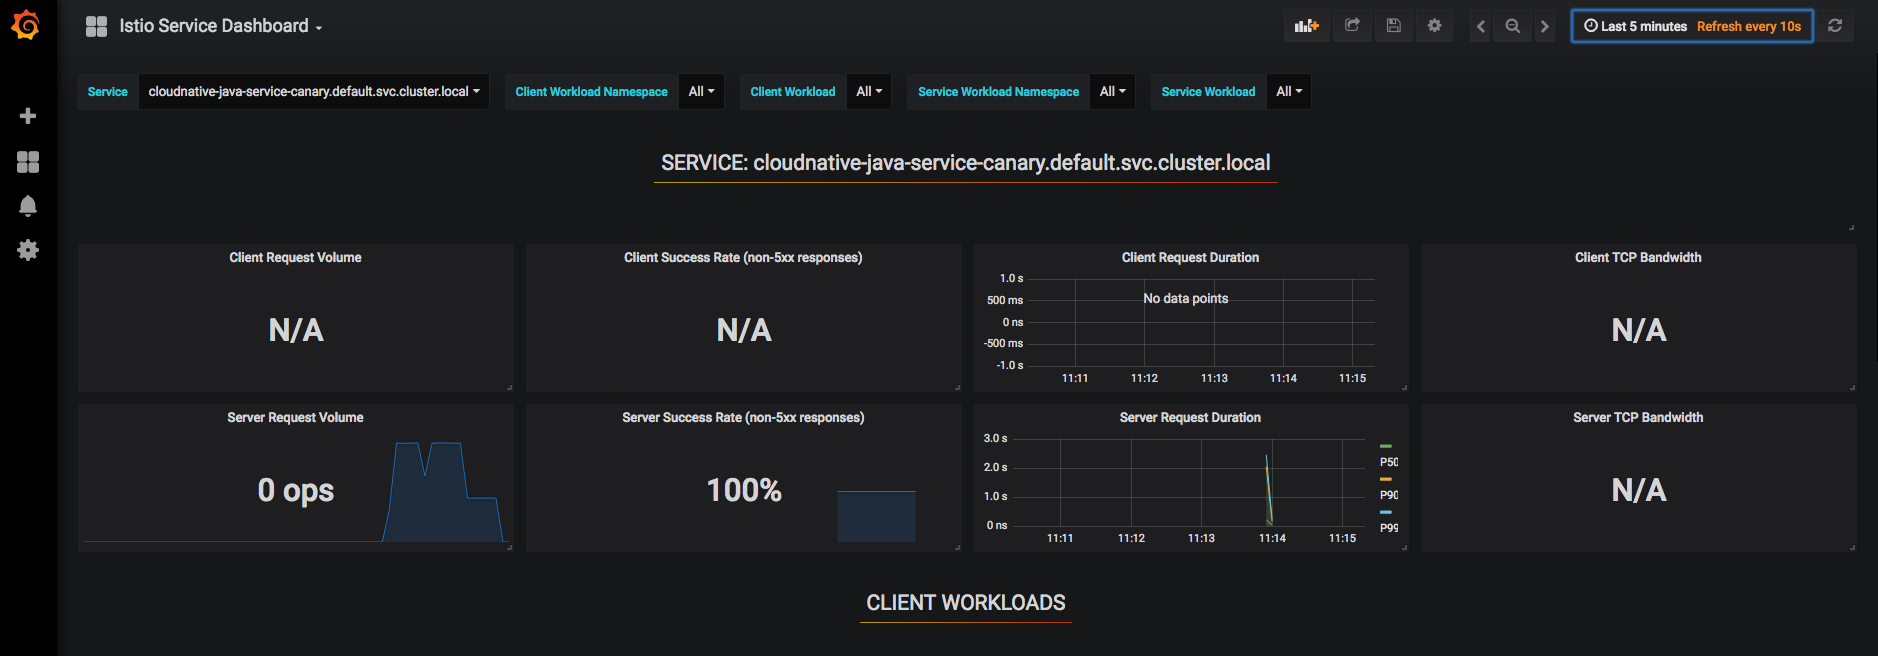
There is also a Grafana with Prometheus as datasource, again we port-forward
1
kubectl -n istio-system port-forward $(kubectl -n istio-system get pod -l app=grafana -o jsonpath='{.items[0].metadata.name}') 3000:3000 &
And then access it http://localhost:3000/dashboard/db/istio-dashboard
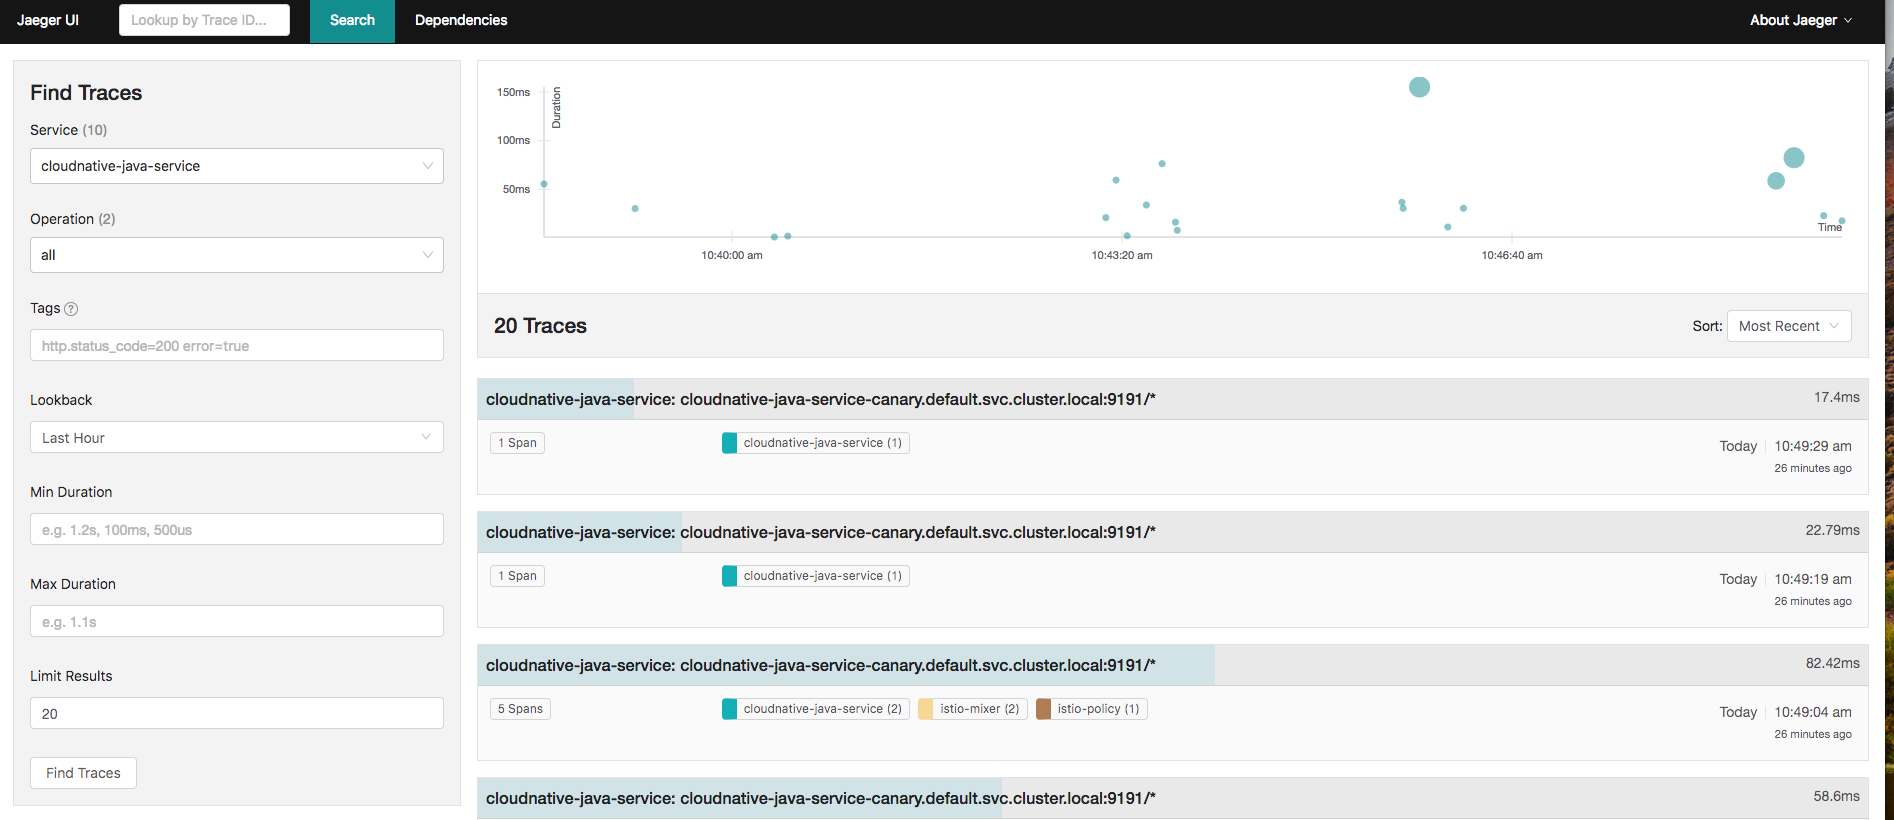
Distributed Tracing
In a previous post I talked about Distributed Tracing using Opencensus, Zipkin, ELK and Spring Cloud Sleuth. It all required some level of coding to get it done. But with this command
1
kubectl port-forward -n istio-system $(kubectl get pod -n istio-system -l app=jaeger -o jsonpath='{.items[0].metadata.name}') 16686:16686 &
We can visualize traces in Jaeger here .
There are other benefits all with Kubernetes and Istio combination. But I hope this post can be used as foundation to build upon that.
In my next post, I’ll move the current setup to the cloud. Find source codes here
REFERENCES
https://kubernetes.io/docs/setup/pick-right-solution/
https://kubernetes.io/docs/concepts/overview/components/
https://container-solutions.com/kubernetes-deployment-strategies/