
Load testing is about putting production level demand on a system to simulate production. This helps measure and define requirements for best performance. I’ll show how we can easily set up one of the load testing tools out there to achieve this.
K6 is a developer centric open source load and performance regression testing tool for testing the performance of your cloud native backend infrastructure: APIs, microservices, serverless, containers and websites. It’s built to integrate well into your development workflow and CI/CD automation pipelines
I like it because of the ease to integrate in a CI/CD pipeline. The installation guide is pretty straight to the point. Which can be automated with ansible or terraform when setting up QA environments.
1
2
3
4
5
6
7
8
9
import { check, sleep } from "k6";
import http from "k6/http";
export default function() {
    let res = http.get("http://localhost/");
    check(res, {
        "is OK ": (r) => r.status === 200
    });

};
This is a simple script to load test nginx running on port 80. We can start it with this command :
k6 run --vus 30 --duration 60s loadtest_nginx.js
Which basically means 30 virtual users trying to access nginx on port for 60 seconds. When completed we’ll mostly likely see something like this.
K6.io supports four different metric types : Counter, Gauge, Rate and Trend. You also have the ability to create custom metrics.
1. Counter : Cumulative metric
1
2
3
4
5
6
7
8
9
10
import http from "k6/http";
import { Counter } from "k6/metrics";

let CounterErrors = new Counter("Errors");

export default function() {
    let res = http.get("https://test.loadimpact.com");
    let contentOK = res.html("h2").text().includes("Welcome to the LoadImpact.com demo site!");
    CounterErrors.add(!contentOK);
};
2. Gauge : Keep track of the latest value only
1
2
3
4
5
6
7
8
9
import http from "k6/http";
import { Gauge } from "k6/metrics";

let GaugeNginxContentSize = new Gauge("nginx gauge");

export default function() {
    let res = http.get("http://localhost");
    GaugeNginxContentSize.add(res.body.length);
};
3. Rate : Tracks percentage of values in a series that are non-zero
1
2
3
4
5
6
7
8
9
10
import http from "k6/http";
import { Rate } from "k6/metrics";

let RateNGINX = new Rate("nginx rate");

export default function() {
    let res = http.get("http://localhost");
    let httpStatusOK = res.html("h1").text().includes("Welcome to nginx!");
    RateNGINX.add(httpStatusOK);
};
4. Trend : Calculating statistics on the added values (min, max, average and percentiles)
1
2
3
4
5
6
7
8
9
import http from "k6/http";
import { Trend } from "k6/metrics";

let TrendNginx = new Trend("nginx");

export default function() {
    let res = http.get("http://localhost");
    TrendNginx.add(res.timings.duration);
};
If I forgot to mention this, you can also create custom metrics. But how do we automate this and include this in our CI/CD pipeline. This is particullary for cases whereby there’s a certain threshold of requests our application can handle and we don’t want any update setting us back.
K6.io supports creating thresholds as well. For example a simple threshold to make sure our application has than 0.5 failure when bombarded with requests from 30 virtual users in 60 seconds. It’s of type rate. k6 run --vus 30 --duration 60s loadtest_nginx_threshhold.js
1
2
3
4
5
6
7
8
9
10
11
12
import http from "k6/http";
import { Rate } from "k6/metrics";
var failedRate = new Rate("failures");
export let options = {
 thresholds: {
   "failures": ["rate<0.5"],
  }
};
export default function() {
 let res = http.get("http://localhost/");
 failedRate.add(res.status != 200);
};
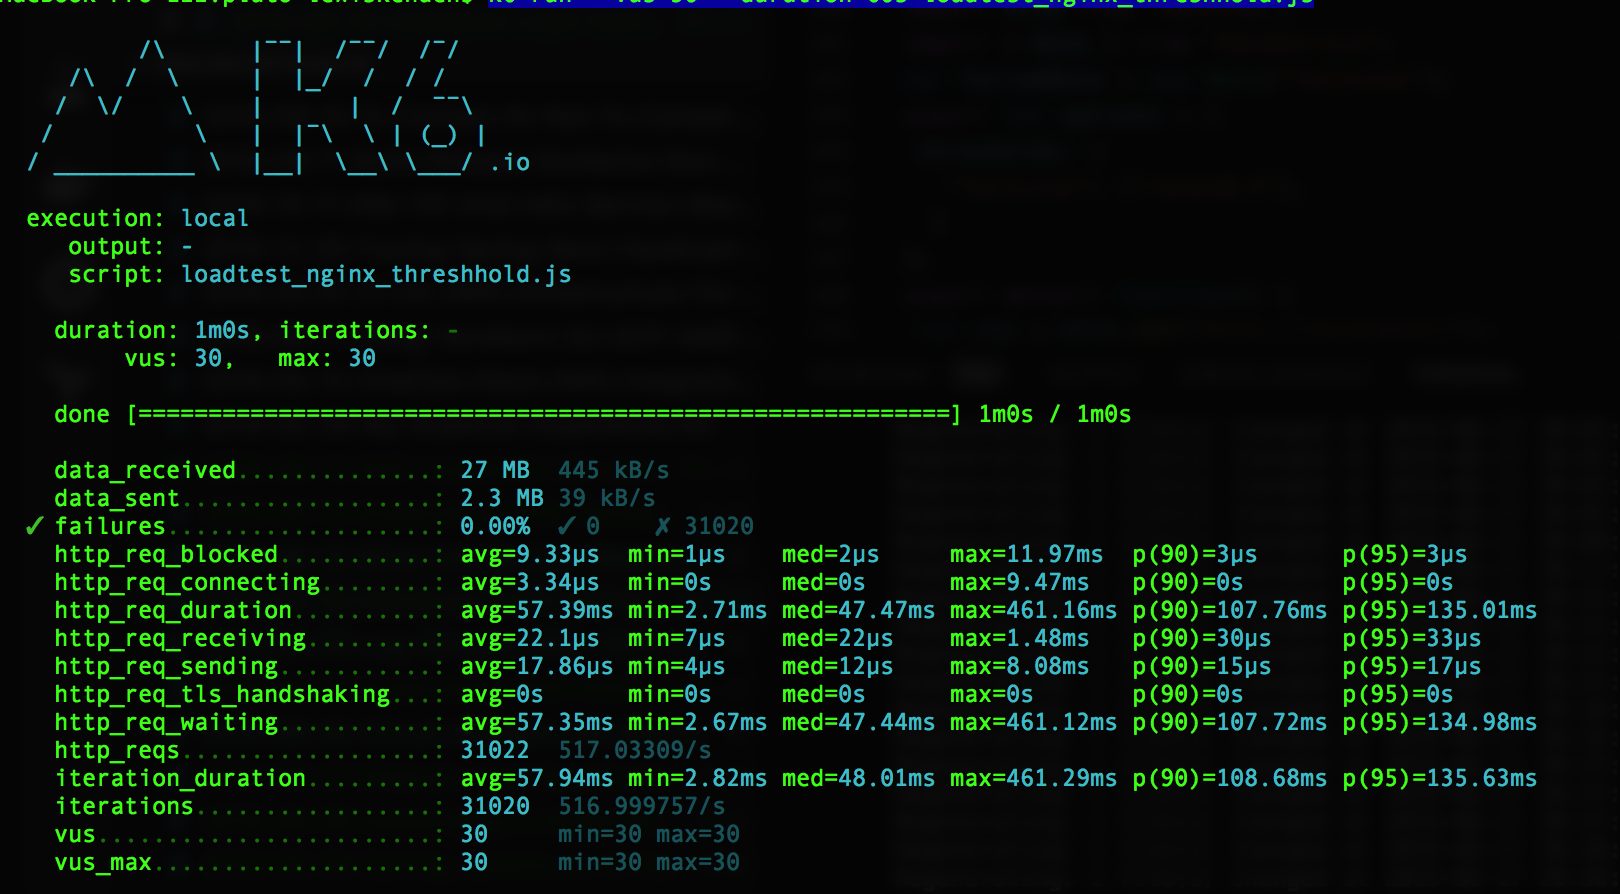
We can use the results as a gate keeper to either continue the process in the CI/CD pipeline or not. It’s pretty simple.
REFERENCES